

By Jim Lewis, CEO Enhanced Retail Solutions LLC
So much of our work revolves around replenishable items that we sometimes neglect fashion. People will often say that a deep level of planning is not necessary for fashion, especially “one and done” items. I disagree. Fashion comes in many forms and flavors but can still be optimized by a bit of smart planning. In today’s environment, don’t you want to squeeze every dollar out of every item?
Planning Fashion
There are a few key aspects of planning that I think can impact the success or failure of fashion items. They include understanding the volume thresholds, tracking lost sales, initial allocation strategies and creating benchmarks for measuring performance. Let’s look at each of them in more detail.
Thresholds
Thresholds are the maximum amount you can sell of something profitably. It’s great when designers and sales teams get behind an item, but sometimes those emotions don’t line up against the numbers. Stores have specific audiences and only have so much foot traffic. For example, even though Walmart has millions of feet in its stores every day, every store is different. This is where store level POS data is essential.
Assign attributes to items so that they can be studied and grouped together over time. Use the first 4 or 8 weeks of sales to develop a benchmark, then compare items based on those benchmarks. This also enables you to align performance regardless of when an item was introduced. If items are affected by seasonality, then create benchmarks for each quarter of the year. Then calculate the rate of sale (average weekly sales) when in stock (on hand >0) for every store and add it up. This helps determine how much a store can sell, given they are appropriately inventoried.
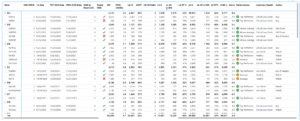
Tracking performance based on the first few weeks of selling against an out of stock date. Did you leave money on the table?
Lost Sales
Determining lost sales for replenishable items is straightforward. If a store is out of stock for a period of time and the out-of-stock date is in the future, you potentially missed sales. But you can still estimate lost sales for fashion items in a similar fashion.
For items with limited life span, use the targeted out of stock date to determine the threshold. For example, let’s say you ship 10,000 units and they should be completely sold through in 8 weeks. If by week 6 you are sold out, you potentially missed the opportunity to sell 2 more weeks. Whatever the average weekly sales are, multiply it by 2 to determine lost sales. You can apply the same logic to ecommerce channels.
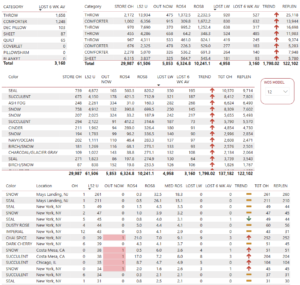
Track inventory by location, stock outs and lost sales
Initial Allocation Strategies
Many fashion products are shipped completely in one shot. In those cases, the allocation better be right. Giving every store the same quantity is almost never a smart idea (yet I still see it happening frequently). And just because a retailer tags a store with a volume group or size designation, it can vary significantly by product category. If possible, hold back 10-15% of the units to replenish the top selling stores after the first 2-3 weeks of sales.
When preparing to allocate there are some questions to ask. For similar items in the past, did some stores sell out very quickly and others did not sell anything in the first few weeks? Keep lists of both. Does regionality or climate play a role in sales?
After a few weeks of selling, make a list of the opportunity stores (didn’t get enough) and liability stores (got too much). Try to use attributes of the items and assign them to be used in the future.
While most retailers can’t (or won’t) transfer goods between stores, they do generally provide store level sales associates with the ability to look up the inventory in nearby stores. They can then call stores to hold merchandise or in some cases make deliveries to customers.
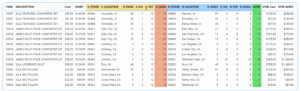
Determining which stores got too much and too little can help plan future allocations more optimally.
How to measure across time
Depending on the type of product you have, new items could be like older items or completely different. The key is to build a record of types of products that do well, when they do well and with the demographic characteristics of who they sell to. You not only need a baseline to judge product performance, but you should be able to study across time. You want to answer questions like, was this year’s capri better than last year’s or 2 years ago. To do that we like to look at performance in the first 4 or 8 weeks. Units sold, sell through and revenue are usually studied. By doing it this way, you can compare how something did at any time it was introduced. For example, maybe last year’s capri sold through in the first 3 weeks and this year it took 6 weeks. What were the attributes of last year’s model?
Final Recommendations
None of these planning functions would be possible without proper attributing of items. You don’t need 100 of them, but at least 5 or 6 to give you enough information to make future decisions about products. Timing is also critical. It is easy to calculate first date there was inventory in stores (or online) and the first date a sale occurred. You’ll need that for benchmarking. Other attributes such as season, market month and year can help group items together and track performance.
Comments are closed