BI Forecast
Forward-looking inventory planning built around your data.
BI Forecast helps teams move beyond static reports and spreadsheet-based planning by turning sales history, seasonality, and inventory position into forward-looking forecasts and recommended inventory actions.

Plan Inventory Before Problems Show Up
Inventory planning gets difficult when teams are trying to forecast demand, manage on-hand inventory, account for lead times, and identify risk across hundreds or thousands of items. Our BI Forecast brings those inputs together so teams can see where inventory is headed and act before stockouts, overstocks, or missed sales become larger problems.
Anticipate Demand
Use item behavior, sales history, and seasonality to estimate future needs.
Manage Inventory Risk
Compare demand against current inventory, target inventory, orders, and lead times.
Prioritize Action
Focus attention on the items, exceptions, and recommended buys that matter most.
From Item Behavior to Inventory Action
Our BI Forecasts do more than display data. They study how each item performs, project future demand, and compare that demand to inventory, helping teams prioritize the actions that matter most.
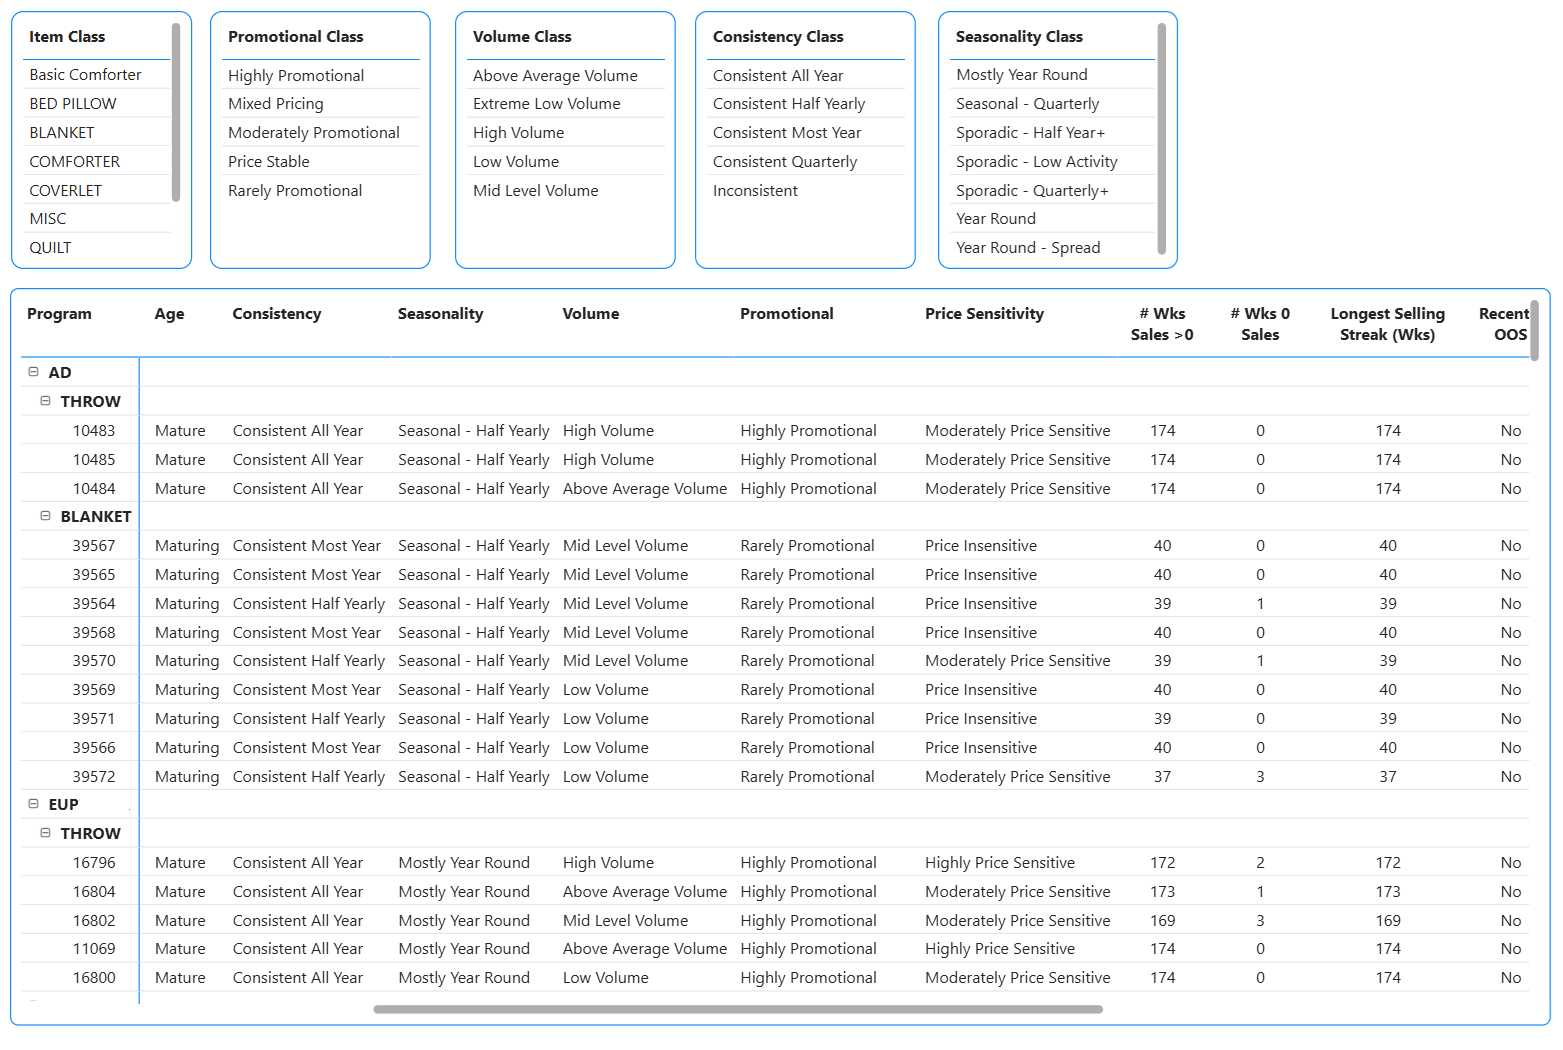
Understanding Each Item
The BI Forecast starts by studying how each item actually performs. The system gets a “feel” for each item by studying how it performs. Is it price sensitive? How seasonal is it? Is the selling sporadic? Is volume high or very
low? All of these criteria are taken into account when the system determines the appropriate model.
This helps the system avoid treating every product the same, even when items within the same category behave differently.
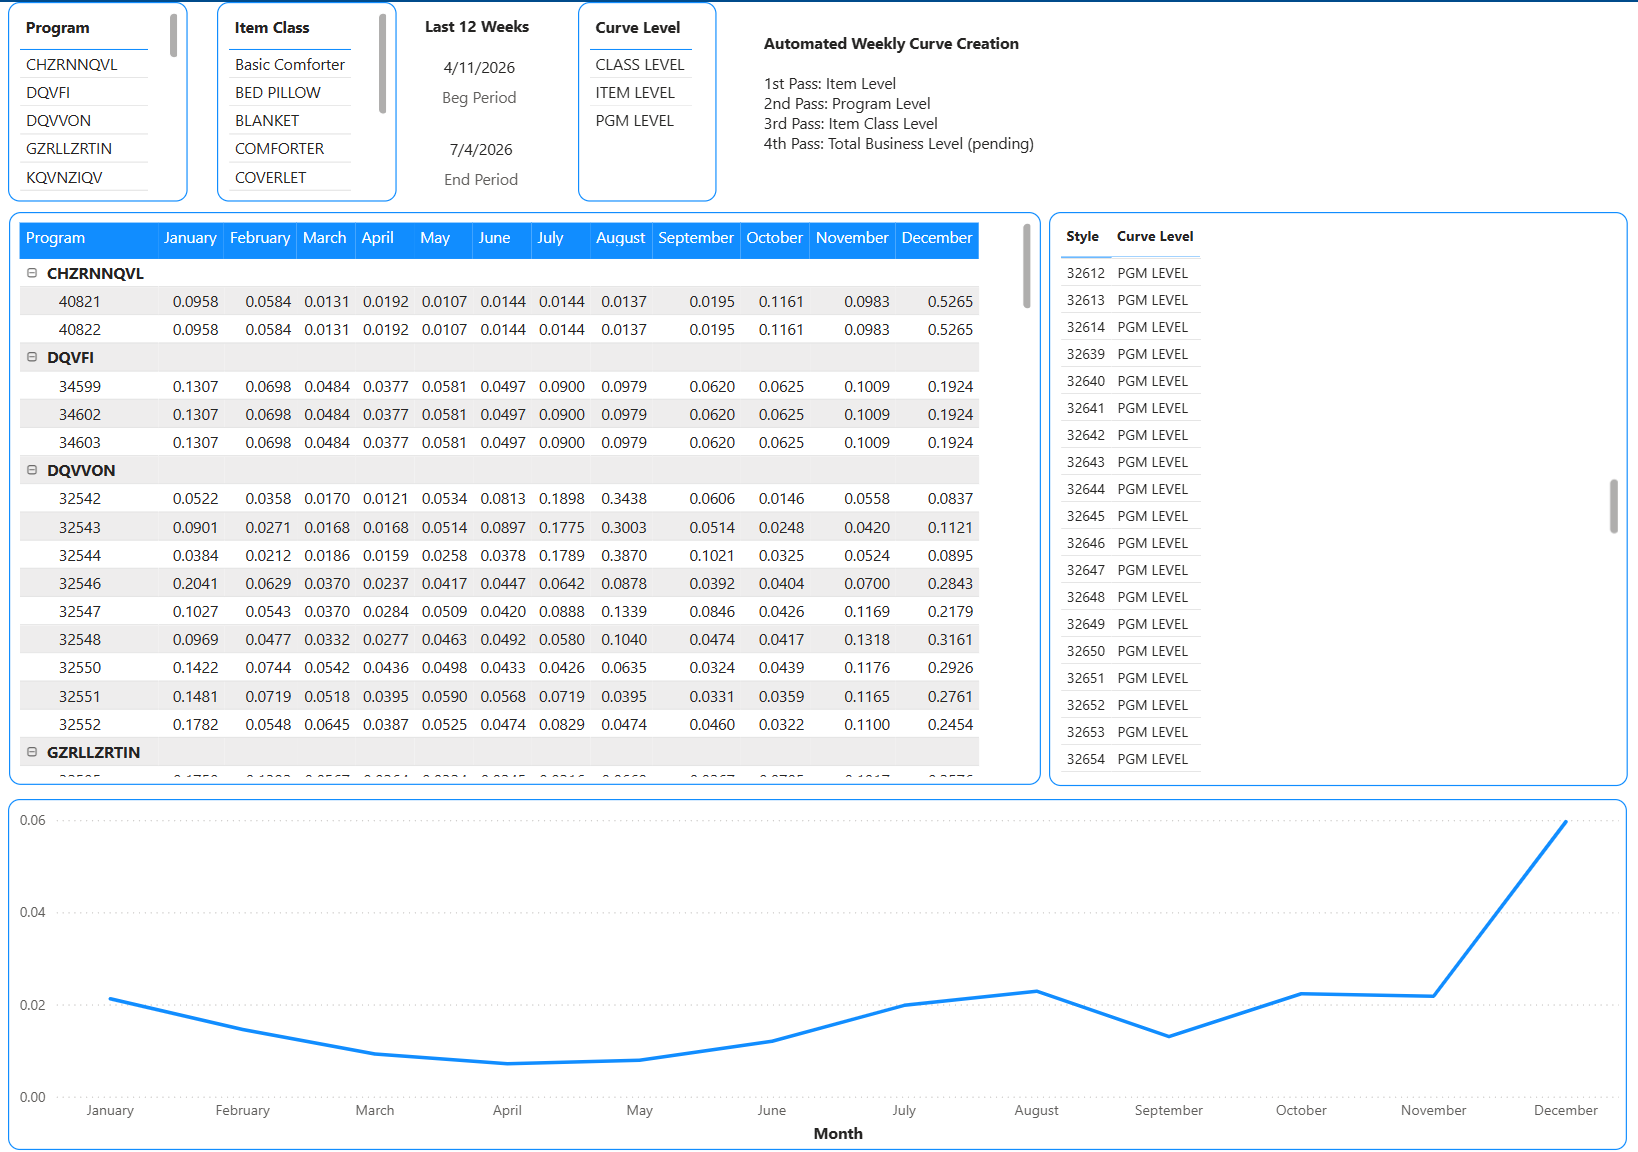
Sales Curve Profiling – measuring seasonality
Each week, the system reviews historic sales trends and determines the appropriate level to assign the seasonality for each item. Does that short-sleeved shirt sell like all the other short-sleeved shirts, or does it look like
it’s on a different trajectory? The system is smart enough to make the proper adjustments.
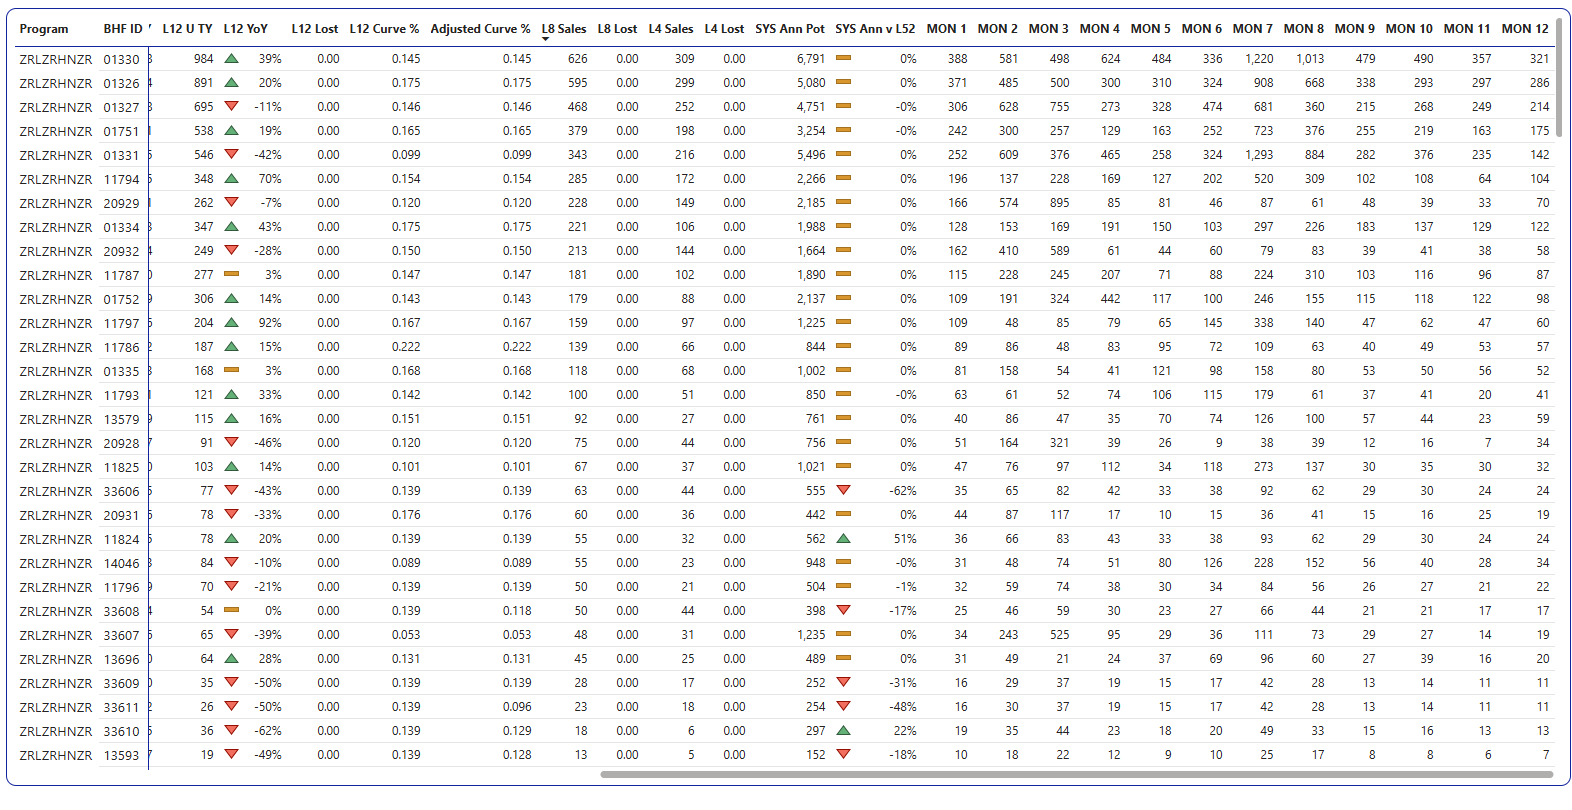
Forecast Model
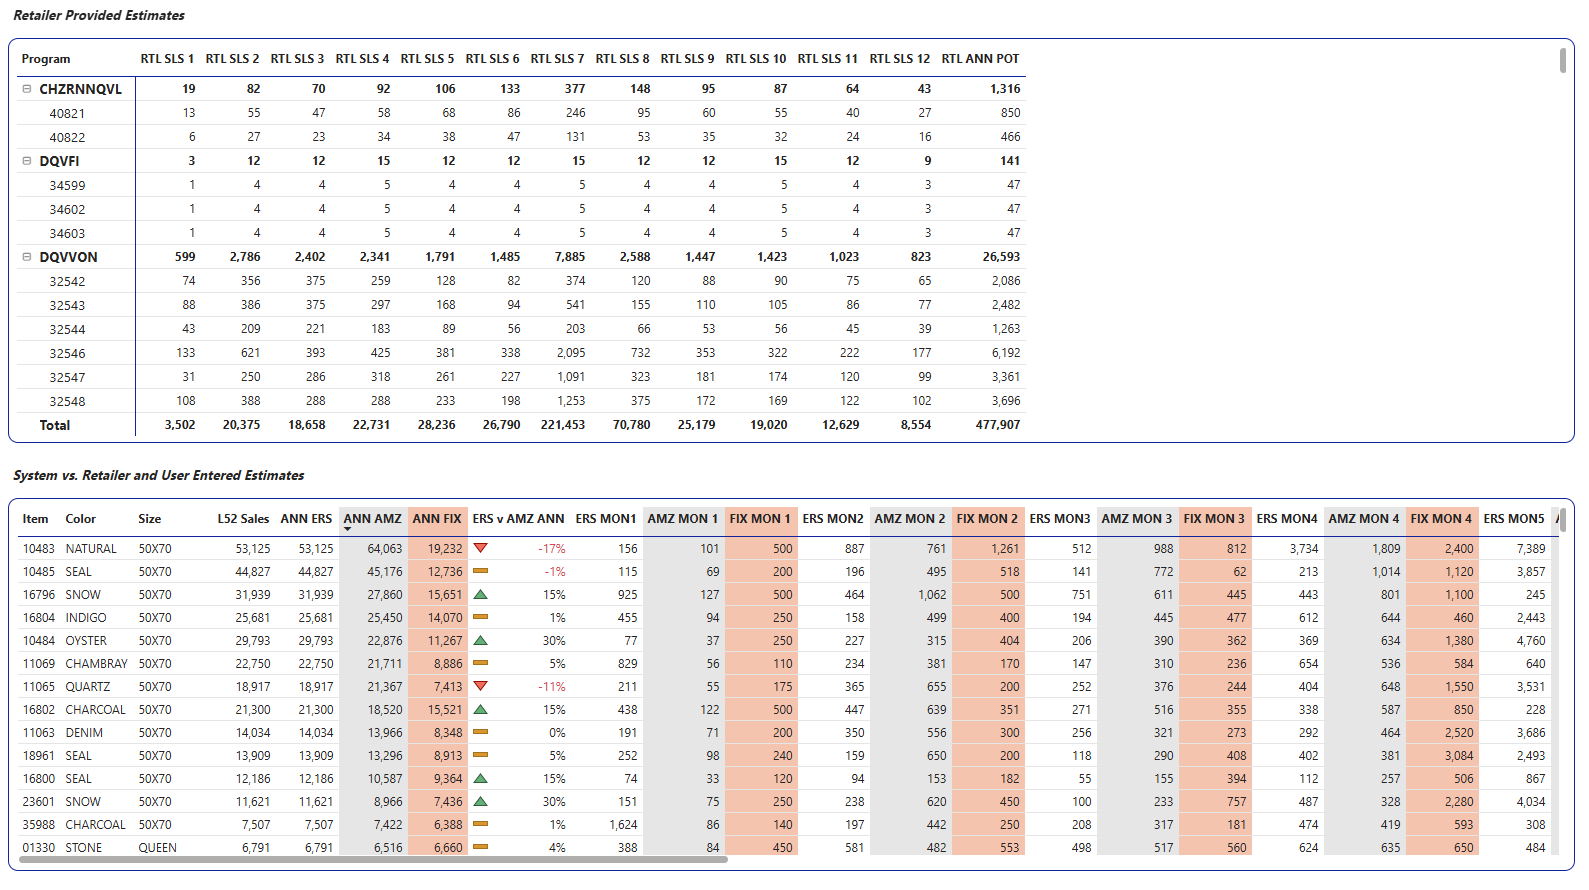
Items are grouped by behavior such as promotional activity, volume, consistency, seasonality, and price sensitivity, allowing the system to begin forecasting sales.



Built Around the Way Your Team Plans
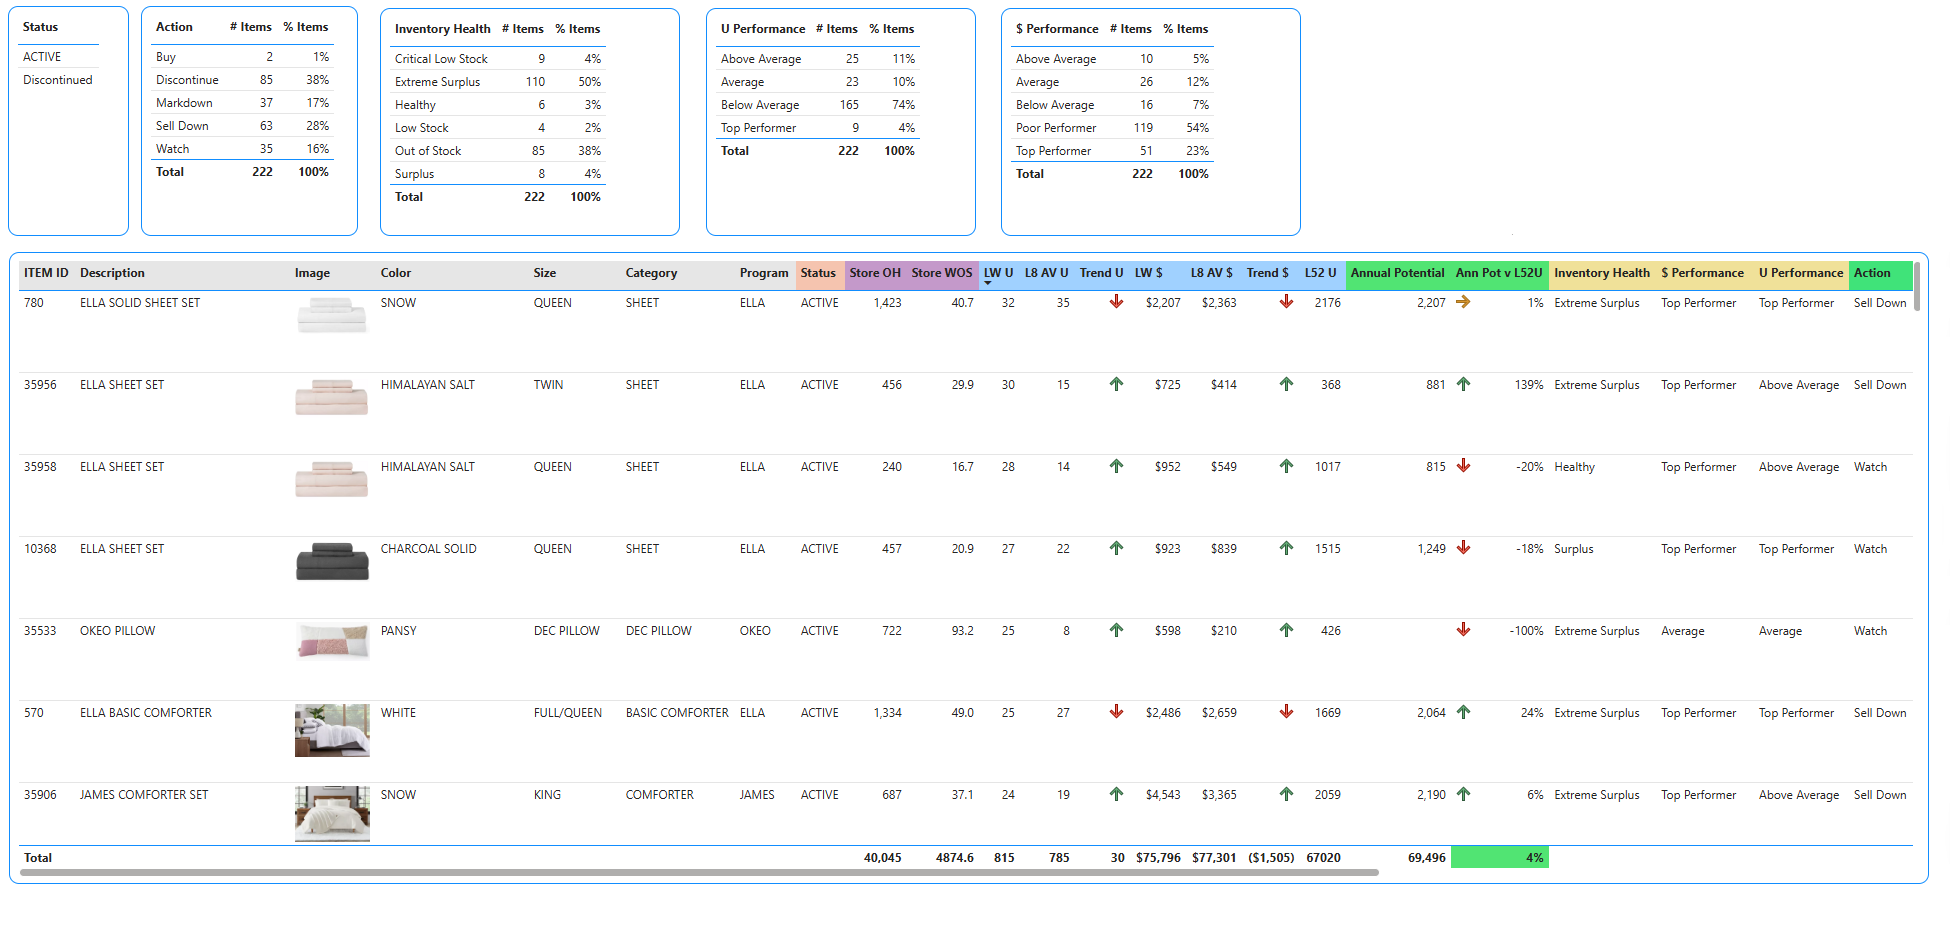
BI Forecast can be tailored around each client’s data, planning rules, reporting needs, and decision process. Teams can customize the views, fields, KPIs, time frames, and planning parameters that matter most to their business.
More Than a Forecasting Dashboard
Many tools can display sales history or show a forecast. Our BI Forecast is different because it combines ERS’s retail and wholesale planning expertise with item-level forecasting logic, inventory rules, and action-oriented outputs.
Item-Level Intelligence
BI Forecast studies how each item behaves instead of applying the same generic logic across every product.
Inventory-Aware Planning
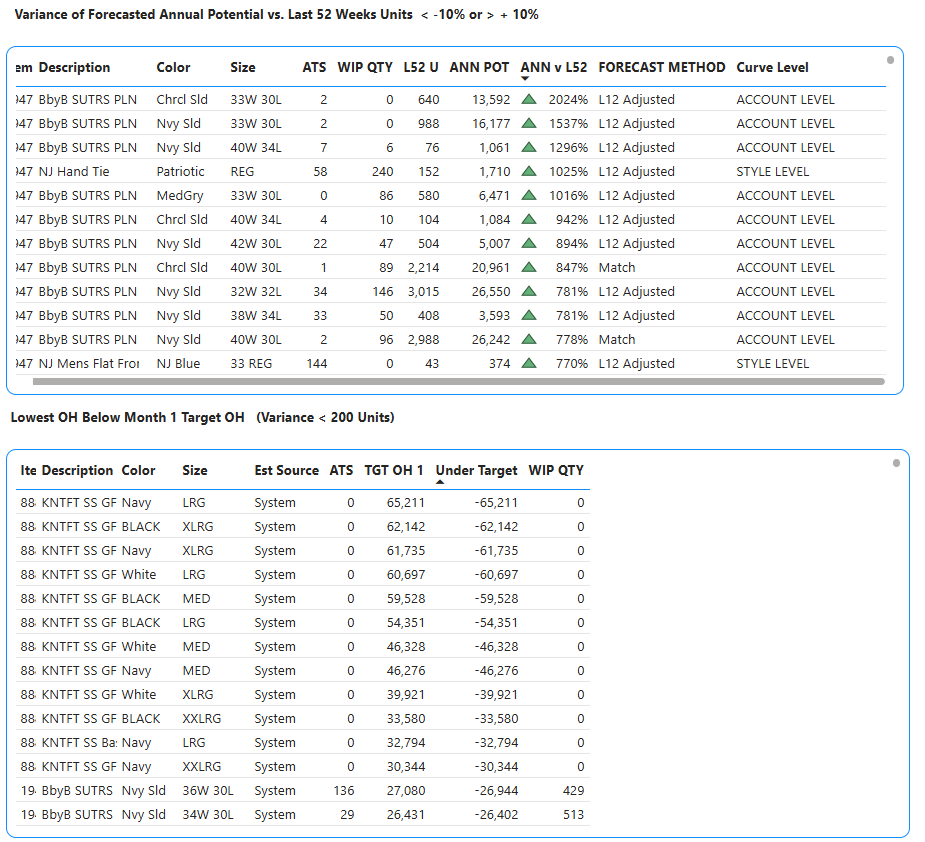
Forecasts are connected to real planning inputs like on-hand inventory, open orders, lead times, target inventory, and weeks of supply.
Action-Oriented Outputs
The tool does not stop at showing numbers. It surfaces exceptions, identifies inventory risks, and helps teams move toward recommended actions.
See Our BI Forecast in Action
Watch the Demo
Watch this walk through of the key BI pages for Item Performance and Forecasting. Contact Us to learn how to test out our tools.
Talk to the Experts
ERS has over 20 years in helping companies turn inventory faster, forecast more accurately, and deepen their visibility to sales. We do this through engagement and providing fully customized tools.
Smarter Tools.
Smarter Planning.
Better Results.
Everything you need to plan and manage inventory except the heavy price tag.
full customizable
The integration of the ERS POS backend, ERP and Microsoft’s PowerBI enables almost limitless views.
baked in expertise
Takes advantage of both human and AI powered intelligence.
fast and accurate
The heavy lifting is done on ERS servers so user interaction is swift.
deep visibility
Views of the pipeline, estimated sales, recommended buys, item performance and more.