
Enhanced Retail Solutions Smart Reporting Capabilities
Take Your POS & Inventory Reporting To The Next Level
Behind every great report is a great planner. Someone who knows what questions to ask and how to align data to answer them. At ERS we live and breathe reports. But what makes a report great? It comes down to how often it gets used
and how much insight it provides. We strive not only to make great reports- but smart reports. Reports that do the thinking for you or point you in the right direction. Do your reports do that?
Contact ERS today to improve your decision making abilities with better, smarter retail sales and inventory reporting. We’ll help you gather your data- EDI 852, Web Portals, Excel Files, Text Files, etc.- and then provide seamless
reporting and analytics from it.
Anatomy of A Smart Report
These 5 must-have features are the key to getting the most use out of your reports.
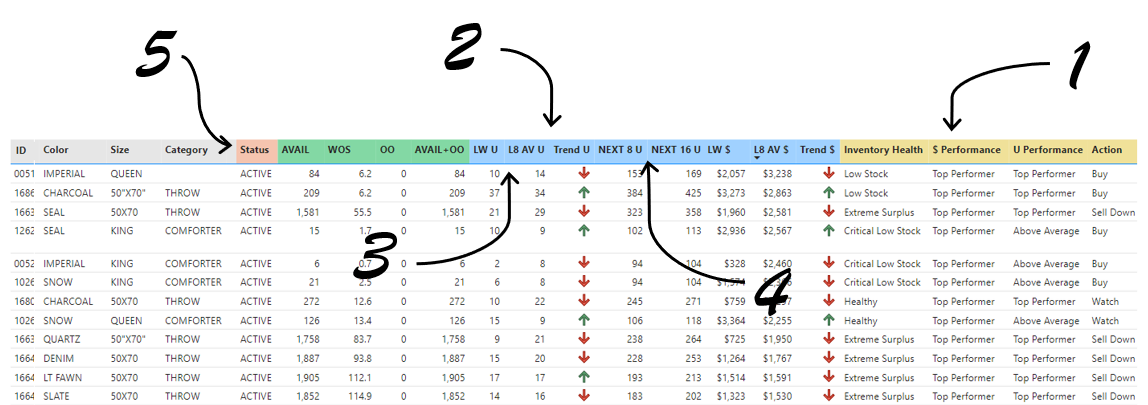
1 Provides Actionable Insights
Most reports are simply rows of data that require the reader to make heads or tails of it. Subtotals are great, but that doesn’t make a report smart. Smart reports are infused with expertise that make a specific recommendation of action for an item.
3 Contains Comparative Time Frames
You learn by comparing, so smart reports provide benchmarks or different time periods from which the reader can quickly determine trends. The most common are TY v LY, week over week, month over month and 4 or 8 week averages. Other variations like before a promotion and after a promotion are helpful.
5 Helps Manage Item Status
For those companies with a significant number of SKU’s, status plays a vital role. It helps prioritize action that may need to be taken. Using around 5 statuses enable a good understanding of where your inventory stands.
2 Has Visibility to the Total Pipeline
Planners on both the retail and supply side want to see each other’s inventory position at some point. Integrating them in one report is one of our top requests. Seeing the total on hand, available at warehouse and future production reduces surprises and saves the time and effort of having to look at additional reports.
4 Shows the Past, Present & Future
Most reports have the past and present down. Few incorporate the future. Forecasting is a discussion within itself, but even the simplest estimate of the next 8 weeks can be helpful. Basing the weeks of supply on the future is far better than the past.
Customized Dashboards that Aren’t Just Pretty
We will design customized dashboards to help you answer questions about your business. Let the intelligence comb through your millions of lines of data to make recommendations on how to improve your business. All are created to spur on action- unlike static reporting that just gives you information.
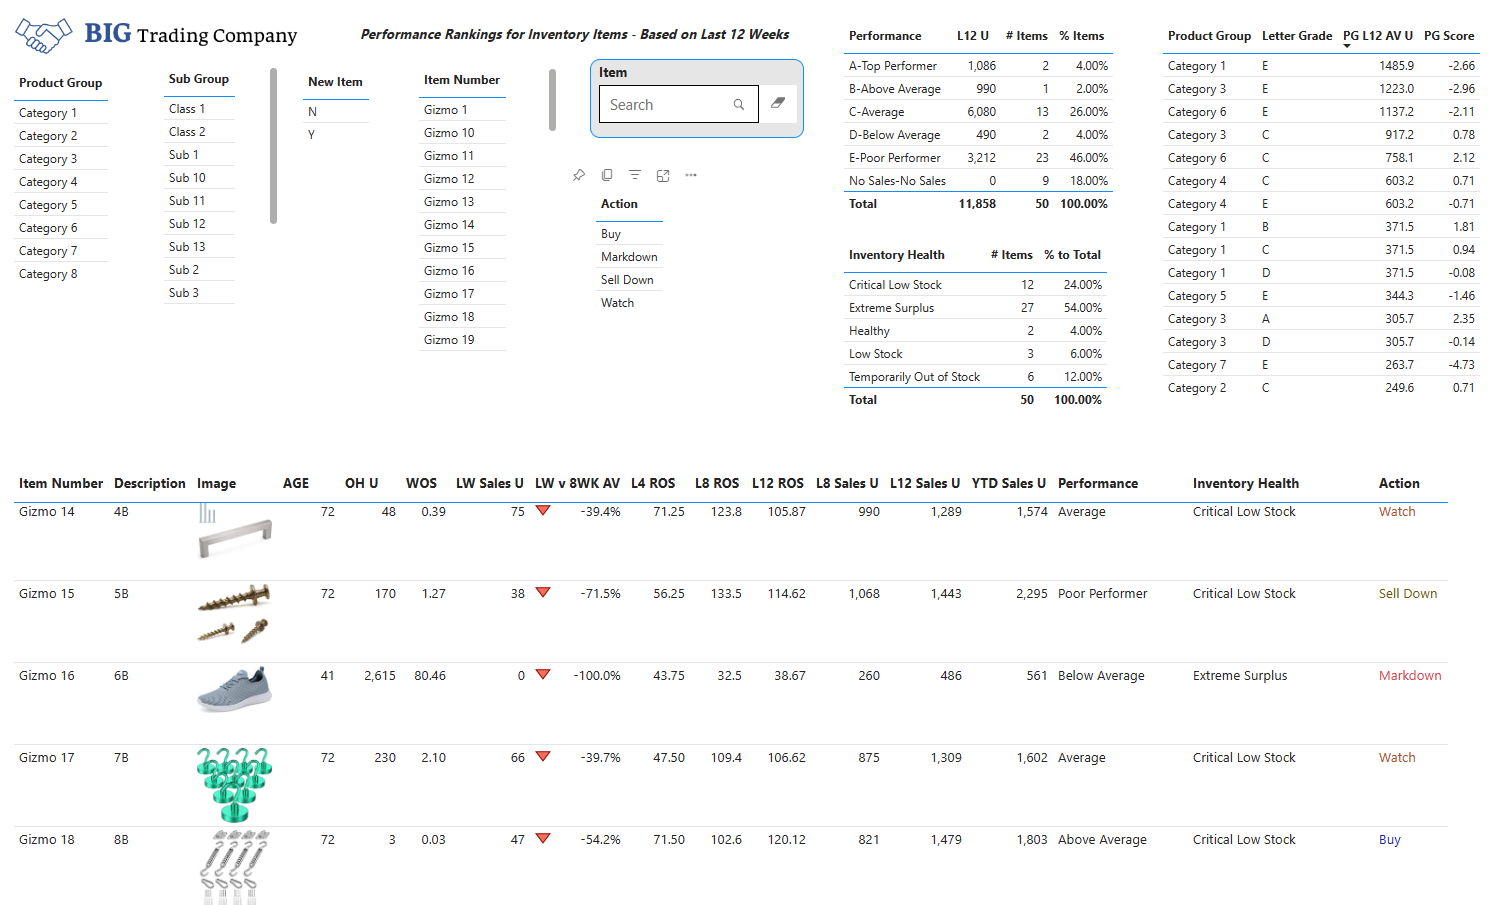
Get the Big Picture
Get a handle on your business. This one scorecard gives you everything you need to get a handle on your business. Is your team spending hours putting this information together? This automatically refreshes each week- giving them all the time back to take action rather than building reports.
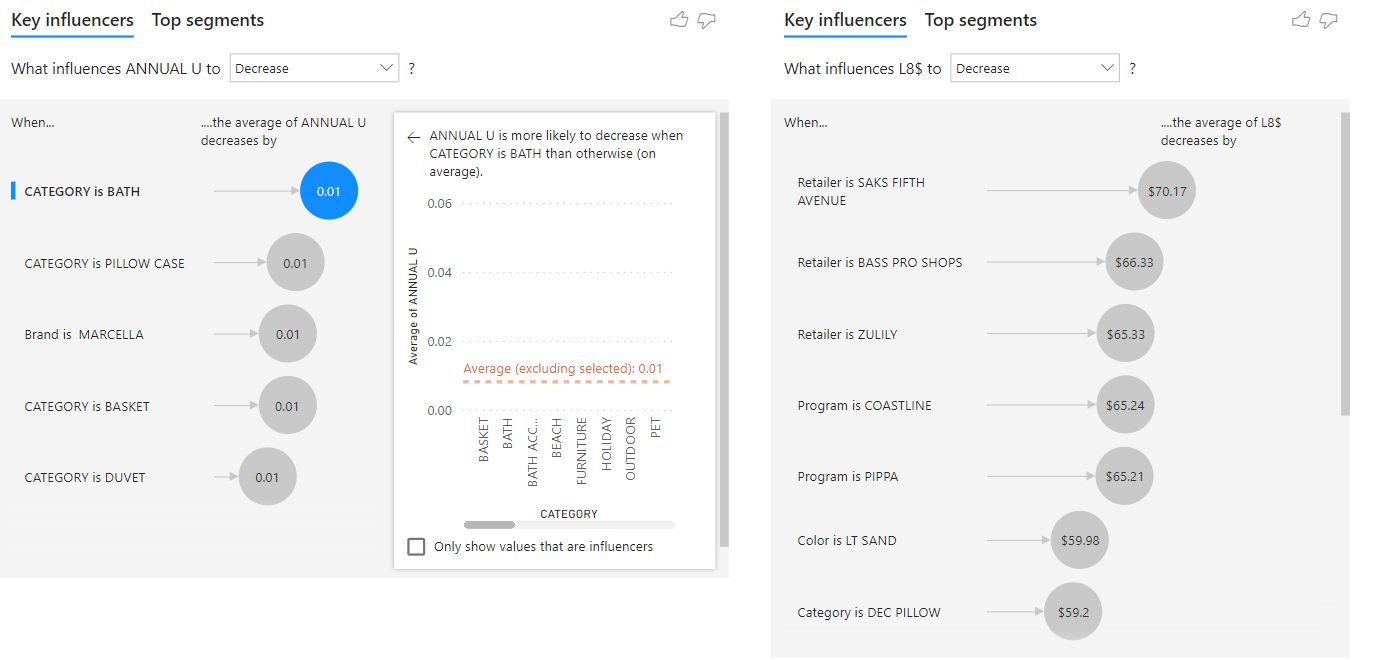
Pinpoint Opportunities and Liabilities
Quickly learn which new items are performing best, which items have the most sold out stores, which items have too much inventory and any other key factor important to optimizing your business. Add geography and demographics to learn even more.
Using the Influencer AI visualization in Microsoft PowerBI enables you to unlock patterns in your data you may not have known existed.
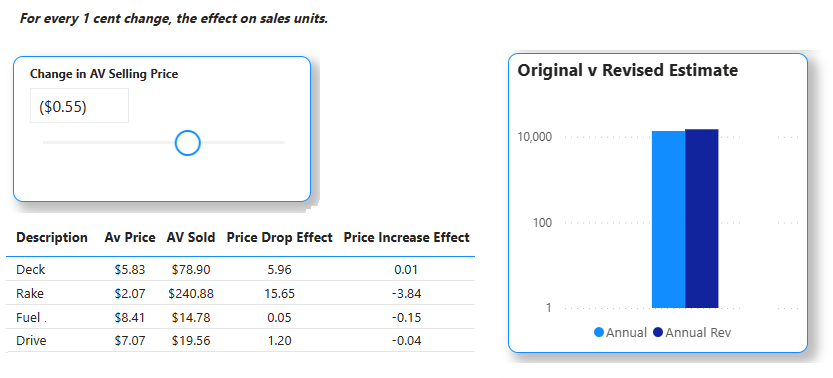
Improve Pricing Strategy
This dashboard studies your history to understand what effect prices have on your sales and predict future sales and revenue based on it. It will automatically adjust the forecast based on promotional activity.
A paradigm change in reporting
We built a system that does the analysis for you.