
Lost Sales Reporting
Don’t leave money on the table because inventory didn’t meet demand.
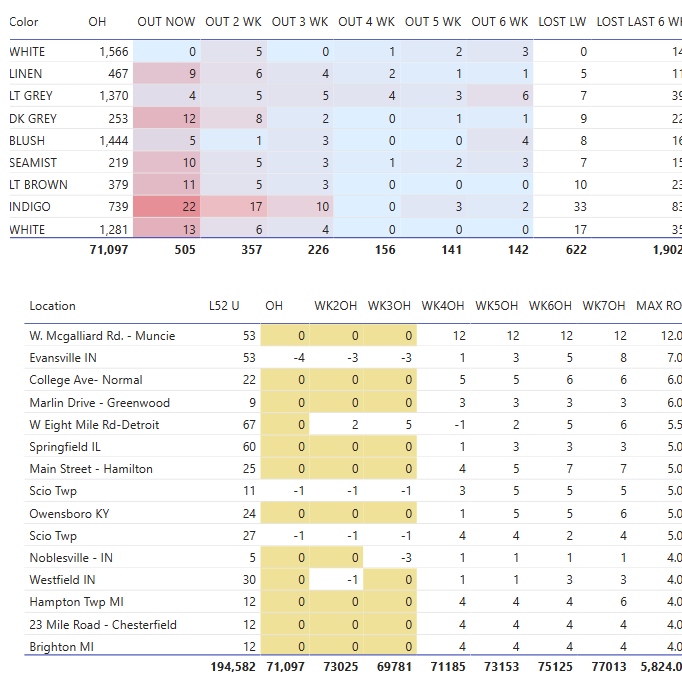
Disappointing a customer by not having the merchandise they want is a crime in today’s retail environment. There are many reasons for stock-outs, many of which are preventable.
So how do you prevent them? Step one is understanding how much business you may be losing. Step two is building a recipe to improve in-stocks by adjusting allocation models or buying more intelligently.
Our reports do both.
Don’t Leave Money On The Table
Inventory levels by location must be sufficient to support the sales potential. This approach utilizes the least amount of inventory and generates the most amount of sales.
POS Store Level Data
You need data at SKU-store level every week to analyze the business.
Determining Rate of Sale
Only consider sales when you were fully in stock over a specific period of time.
Save
Time
Save yourself days, our reports run in seconds and can be delivered to you automatically.
One Size Does Not Fit All
Sending the same amount to every store does not optimize your inventory investment.
Correct the Forecast Basis
Not adding lost sales into your forecast under plans your business.
Quantify in Dollars
Once lost units can be quantified, extrapolate it into dollars.
The Lost Sales Dashboard
We can deliver a lost sales report in a variety of ways: a custom web portal for your organization, Microsoft Power BI or Microsoft Excel workbook.
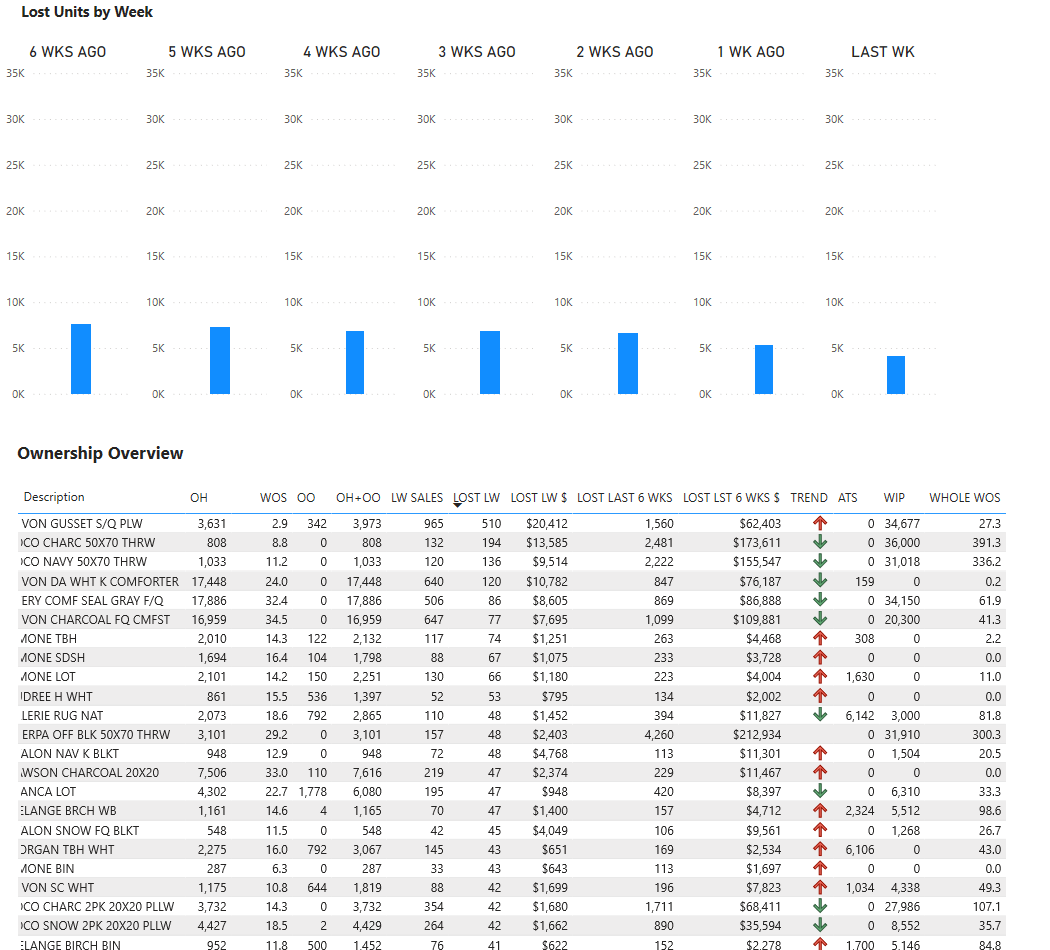
Track lost sales over time to see the impact your actions are taking.
Integrate Retail & Wholesale inventory together to gain complete visibility of your ownership.
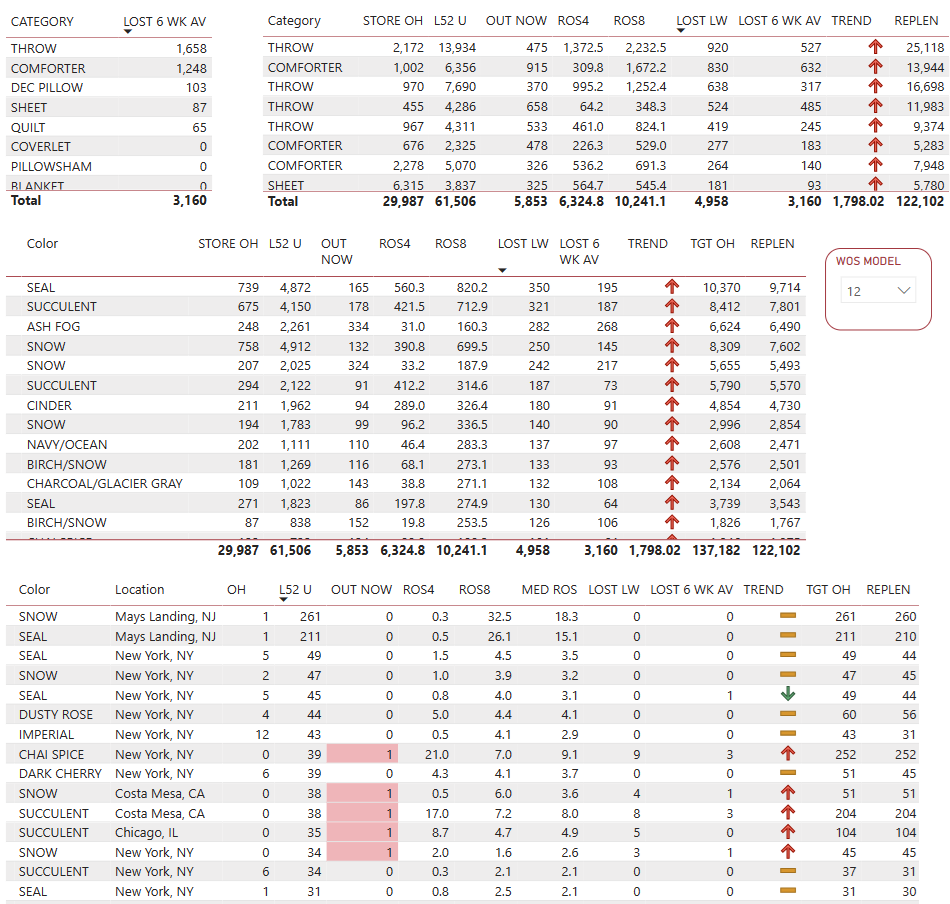
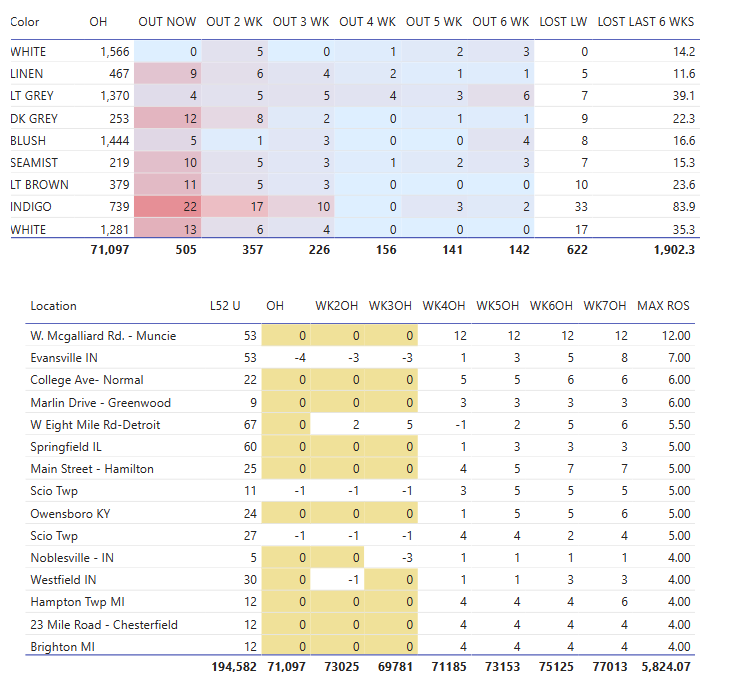
Visibility by week is key. Besides calculating lost sales, understanding how long it takes to get back in business helps in the planning process.
Look at everything or set up filters to only show the exceptions and what to take action on.
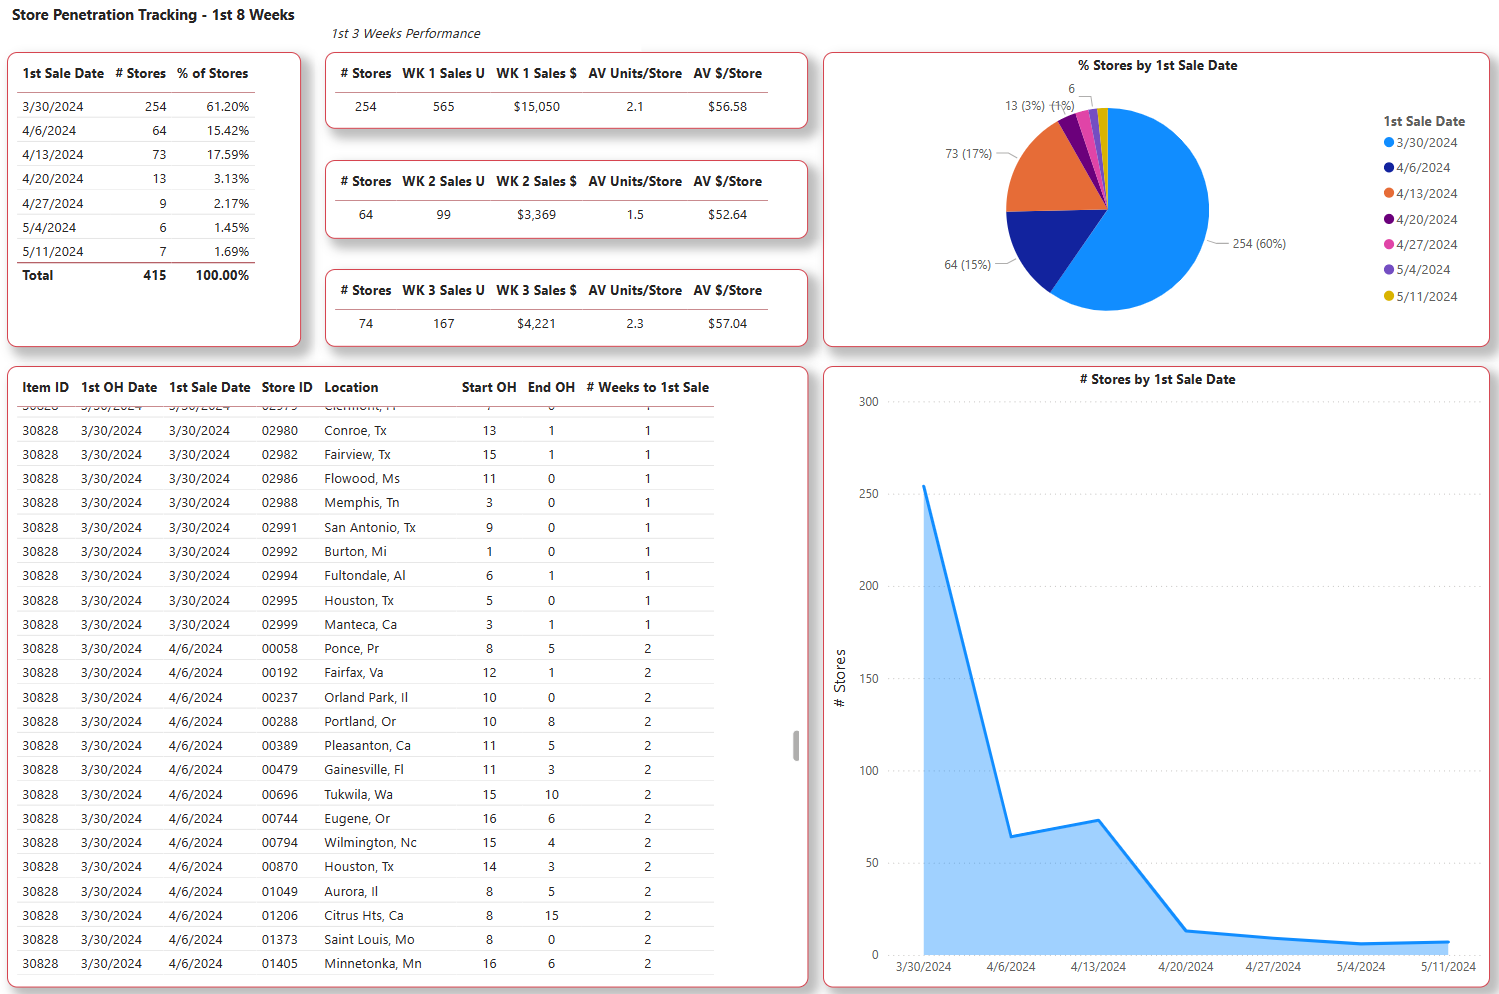
Preventing Lost Sales
It starts with ensuring every store has the right inventory mix at the right time. Both retail and wholesale inventory planners work tirelessly to do that. But they don’t all have the necessary tools to do it quickly and efficiently.
Store to Store Transfers
Out of size Large in some stores and have a glut of Large in others? If you have the resources to transfer between stores it is a great way to improve inventory productivity. But doing the calculations is not always fun. It can get complex.
For example, stores that get matched together may have to be in a specific geographic region, or the remaining assortment may not be corrupted. Adding business rules to the analysis makes it hard. Our Store Transfer analysis takes the complexity out of and provides you the matches in seconds.
Proximity Analysis
Doing well with a product or brand at one retailer and want to suggest it to another retailer? Find their corresponding stores within a specified radius and match them up! Reduces the risk of putting product in the wrong stores.
Get the Right Product to the Right Stores
Using demographics or other selling characteristics to identify similar selling stores can also be a great way to optimize the assortment by store. Learn from the past or test products designed with a specific consumer in mind and then tailor the allocation. Far better than just allocating based on temperature, volume group or advertising requirements.