
By Jim Lewis, CEO Enhanced Retail Solutions LLC
In the last few blog posts, we have discussed different strategies for tracking product performance. In this episode we will focus on how important the time component is in tracking and inventory planning. As the adage goes, time is money. Literally- it’s the capital investment in the wholesale/retail business. So, no different than investing in stocks or bonds or art, you must continually watch the value of inventory turnover and decide whether to buy more or get out.
Part of that equation is how long to hold on to an investment. To do that you have to watch the performance over time and determine what’s good or bad. In the previous blogs we’ve shown how to do that at a macro level. Now let’s look at it on a micro level. While this logic can also apply to online/ecommerce business, we’re going to focus on brick & mortar.
New Programs
Let’s use a new program for this example. The introduction of a new program carries with it a high degree of risk primarily because it is unknown. If it is replacing something else in the assortment, it must perform better than the outgoing item. Most buyers look at sell through as the key measurement. That can be deceiving if it’s based on a chainwide number. For instance, a subset of stores may sell completely out in the first week, but the sell through is diluted if including all stores.
The Analysis
Using store level POS data, we can see when inventory arrives in each store and how long it takes to generate a sale. Then we can see how many stores sold something in the first week, second week and so on. You can look to history to determine what the average is so you can compare future items against it. For example, if item A took 3 weeks for 50% of the stores to sell at least 1 unit and it took 5 weeks to reach that benchmark for Item B, there could be a problem.
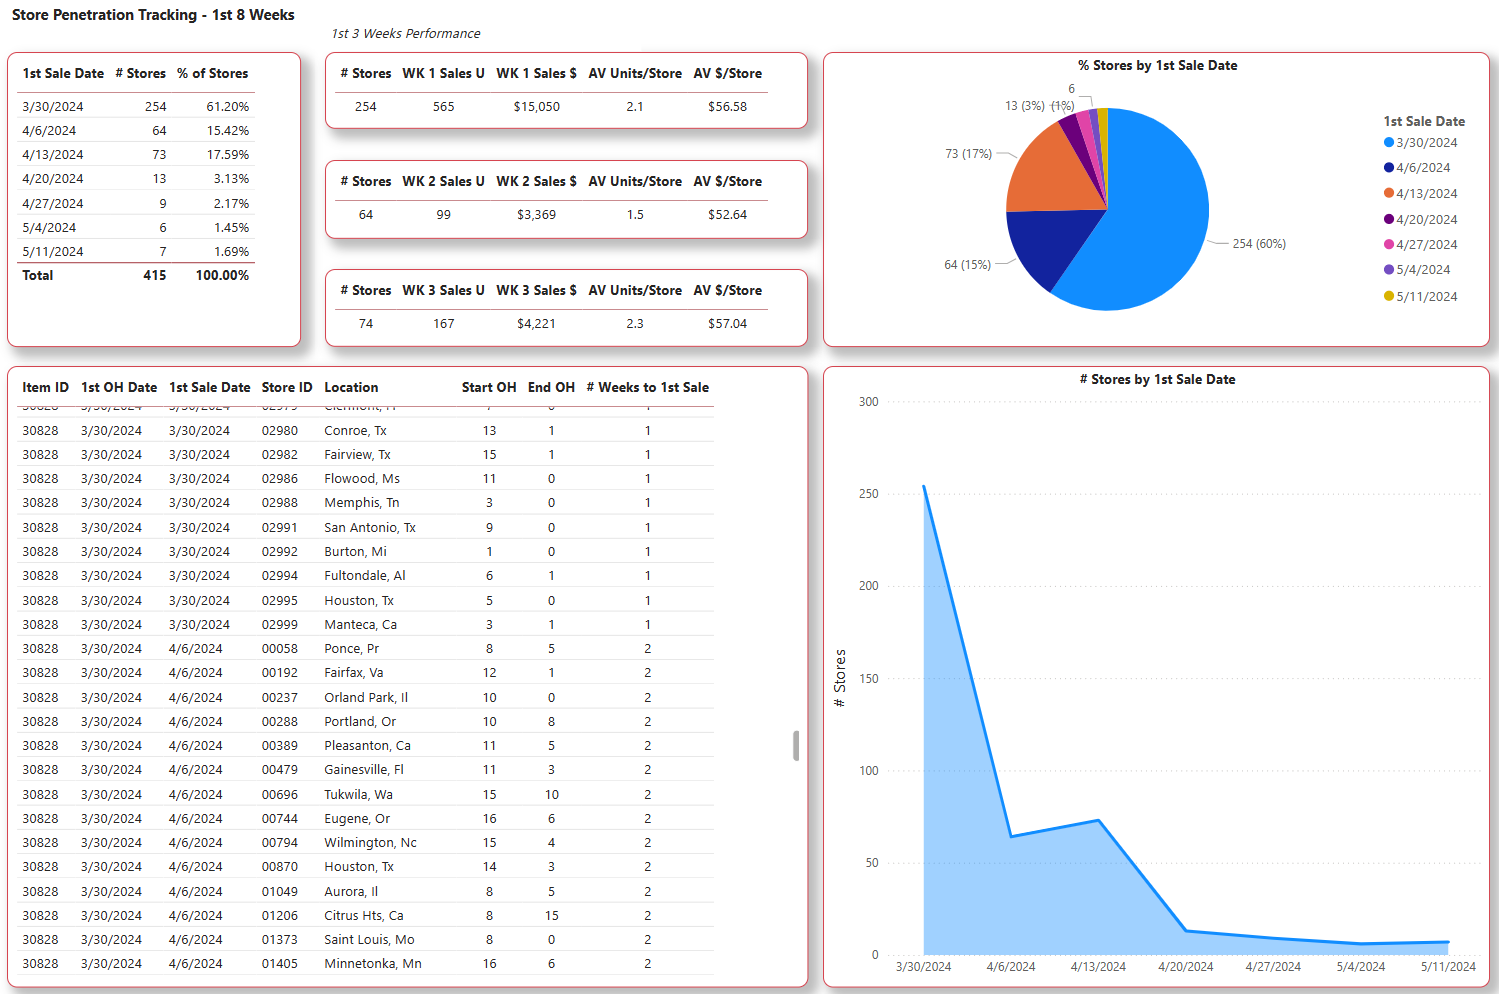
Using our BI Inventory Planning Dashboards, you can see that 60% of the stores sold something in the first week. Another 15% sold their first piece in the 2nd week and 18% in the 3rd week. Pretty good! Most items we look at have very little penetration in weeks 1 and 2, but by week 3 a good portion of stores have sold at least 1 unit.
Track how long it takes a store from when it first receives inventory to making its first sale.
Keep in mind when looking at a nationwide chain, depending on the where the product ships from, some stores may get inventory before others. But you can still use the number of weeks between first on hand and first sale as the benchmark when comparing to other items. And just like comparing the 1st 8 weeks of sales regardless of when a product was introduced, you can use this KPI to compare against items that were introduced at other times. It is also very useful in quantifying lost sales.
Demographics
You can also layer in demographics and geography to determine if a certain consumer characteristics like income, age, ethnicity, etc. is a factor in early preference for an item. Equally important is the number of stores that don’t sell anything in the first few weeks. Is it a store execution issue or does that product not appeal to certain markets? Analyzing these issues can help improve inventory productivity and curate the assortment for maximum revenue and profit.
For assistance in putting together an analysis like this, contact us.
Comments are closed