
By Jim Lewis, CEO Enhanced Retail Solutions LLC
It’s essential in inventory planning to constantly optimize the merchandise assortment. Last week we talked about determining item or program performance regardless of when it started selling. That lets you determine whether a program was better this season than say 3 seasons ago. This week I want to talk about how to track when one business is doing spectacularly better than another.
Let’s take it from the viewpoint of a supplier who sells different tiers and channels of retail. In many cases, the same benchmark of performance is applied to all items regardless of channel or platform. They each have different costs associated with them but the reason for supporting one platform over another may differ. For example, drop shipping may be expensive and generate tiny sales but enables a broader assortment and testing ground for new products. The tradeoff may be worth it. The different philosophies or strategies of selling should be taken into consideration when determining performance benchmarks.
Establishing A Benchmark
Even if a benchmark is established by tier or channel, it may need to be updated as a business grows or declines. For example, for many suppliers that are investing in growing their Amazon business, they may quickly see weekly sales go from a few hundred to a few thousand units. Pretty soon Amazon sales may be significantly higher than that of other pure online retailers. It may no longer make sense to use the same benchmark for every item you sell online.
First you must consider what to base the benchmark on. Sell through is generally great when tracking brick & mortar business because you can see what you sold and how much inventory each store had (POS). But with most online businesses, a shared inventory may be used which makes determining sell through trickier. Perhaps rate of sale is better- average sales units or dollars generated. I like this method because you can set goals. For example, an item must generate at least $500 per week to be worth having in the assortment. Then you can track against that.
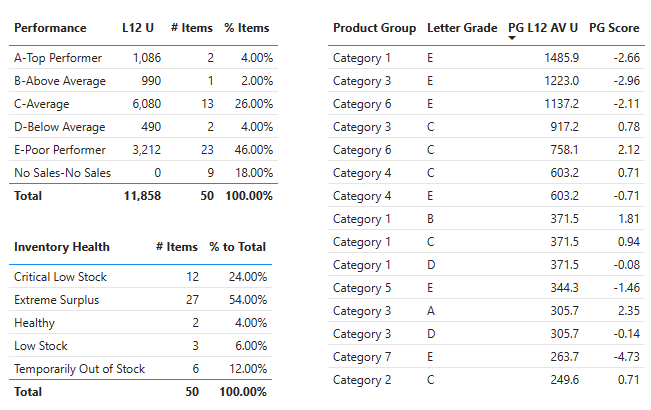
Creating benchmarks to track item performance by category.
Standard Deviation
Keep in mind different categories may have different benchmarks. But once you establish the benchmarks, you can quartile them and then layer each item’s performance against it. We like to show an item’s standard deviation from the benchmark to determine how good or bad it is. Create letter grades or name different tiers of performance. For example:
A: Top Performer: Average weekly sales dollars over $2,000
B: Above Average : Average weekly sales dollars between $1,000 and $2,000
C: Average: Average weekly sales dollars between $420 and $1,000
D: Below Average: Average weekly sales dollars between $120 and $420
E: Poor Performer: Average weekly sales below $120
You can either set amounts like the example above, or have your tool calculate the average over a specified period of time. This is a much better option because it is dynamic- each week it updates based on actual results, and you don’t have to change hard coded numbers. Either way, once the benchmarks are established at category level, compare an individual item’s results to the benchmark. Calculate the Standard Deviation to see how far each item’s sales are from the category average. The higher (positive number) the deviation, the better the items is doing compared to the rest of the items. Conversely, the lower the deviation (negative number) the worse the item is doing compared to the rest of the items.
Create benchmarks by category, then show an item’s standard deviation from that benchmark
Visualize the numbers like we do using Microsoft PowerBI and you can easily click through performance and get a handle on your business. Once performance is determined the next question is why you got that performance. Our solutions integrated other data points to help answer those questions, and that topic is worth a blog on its own.
Comments are closed