The Four Pillars of Success – Part 4
By Jim Lewis, CEO Enhanced Retail Solutions LLC
Welcome to the final part in our “Pillars of Success” blog series. Data science is a hot topic and its influence in the retail industry is no exception. Data is being used to help retailers and suppliers track trends, enhance marketing, match specific products to consumers, determine pricing, improve inventory allocation and much more.
Uses on the Front and Back Ends of Retail
The practical application of data in retail takes place on many fronts including predicting consumer behavior, the shopping experience, price optimization and targeted marketing. On a retailer’s website, if you’ve ever seen a suggestions section with “other items you might like”, you’re experiencing analytics on the front end. Amazon and Apple were early pioneers. Data from multiple sources can be integrated together to reveal even greater insights. There is also a less sexy but incredibly important use for retail data and that is on the back end. That area can include supply chain logistics, optimizing the assortment mix and inventory productivity. Our focus, unfortunately for you, is on that less sexy side.
POS Data
The bread and butter of retail data is POS (point of sale). Studying sales and inventory levels at the lowest common denominator (SKU-Store) offers a litany of opportunity opening capabilities. I believe that because it is at this stage that data is most actionable. You can think of a retailer’s assortment mix as an investment portfolio. Each product (investment) is either an asset or liability. You want more of the good stuff, and less of the bad stuff. For bad stuff, you want to minimize the amount of loss and for good stuff you want to maximize its potential.
The tough part comes in when you have thousands of stores and thousands or millions of items. You need great tools to look for those opportunities and liabilities. There are many great visualization platforms on the market, but you want one from a provider with deep expertise in retail and wholesale. A generic platform doesn’t know what questions to ask of the data. A planning expert will. Here are some excellent POS reporting tools.

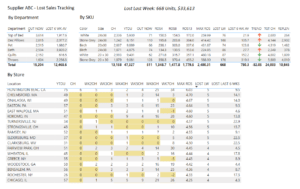
Using store level POS data to determine lost sales
The Role of AI
Artificial Intelligence is being integrated into many facets of our everyday lives. Retail is no exception. As mentioned before, combing through hundreds of thousands or millions of SKU-store data points is a task better suited for non-humans. We use AI, although we like to call it Augmented Intelligence because we baked our retail and wholesale expertise into it. Retail Narrative was one of the first applications of this science that automatically goes through data and analyzes it for the user. Not only does it highlight trends in the business, but it also finds opportunities and liabilities that would otherwise go unnoticed. It then presents the user with the data and additional calculations for them to take action. This would have taken a planner days or weeks a few years back. Now it’s 20 seconds.
The Discipline of Planning
Planning teams use data to manage the business. They watch trends to determine how much inventory to produce and when. Their process includes reporting, forecasting, financial budgeting and more. We call it the Discipline of A Planner. Recommended activities are broken down by week, month, quarter and as needed basis. It includes who in the organization does it and what tools to use. While every organization is different, the retail terminology, math and KPI’s are generally the same. There are measurements for SKU performance as well as inventory health. The key is defining what makes something “good” or “bad”. That depends greatly on the category of merchandise and the retail philosophy. Once an item’s performance and inventory level are measured a planner can decide what action to take- buy more, mark it down, continue to watch it, etc. Smart POS reporting can help them do this.
Replenishment Items
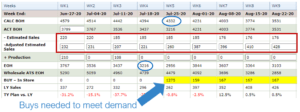
For items that are continuing, or what many refer to as “replenishment items”, a demand forecast is required. These come in all shapes, sizes, and capabilities. To be honest, it’s not brain science. So many make it harder than it needs to be. A forecast generally uses historic data adjusted for calendar or seasonal shifts, promotions, lost sales, and general market conditions to predict the future. You estimate sales and then line it up against current inventory and work in process. The real challenge again is working with thousands of SKUs. That’s where an automated forecast system is preferred to a spreadsheet-based tool. For categories that are more volatile, more data points can be integrated- the price of a gallon of gas, GNP projections, new housing starts, etc. Blending data to tick a forecast up or down based on various factors.

Determine inventory requirements based on estimated sales
There’s far more to explore with retail data science, but I hope this gave you some insight to study it further. As always, if you want to have a conversation and learn how we can help your business, please reach out to us!
JotForm.newDefaultTheme = false; JotForm.extendsNewTheme = true; JotForm.singleProduct = false; JotForm.newPaymentUIForNewCreatedForms = false; JotForm.newPaymentUI = true; JotForm.highlightInputs = false; JotForm.init(function(){ /*INIT-START*/ if (window.JotForm && JotForm.accessible) $('input_1').setAttribute('tabindex',0); if (window.JotForm && JotForm.accessible) $('input_3').setAttribute('tabindex',0); JotForm.setPhoneMaskingValidator( 'input_12_full', '(###) ###-####' ); if (window.JotForm && JotForm.accessible) $('input_4').setAttribute('tabindex',0); JotForm.setCustomHint( 'input_4', 'Type here...' ); JotForm.alterTexts({"confirmClearForm":"Are you sure you want to clear the form","incompleteFields":"Please complete required (*) fields.","lessThan":"Your score should be less than"}); /*INIT-END*/ }); JotForm.prepareCalculationsOnTheFly([null,{"description":"","name":"name1","qid":"1","subLabel":"","text":"Name","type":"control_textbox"},null,{"description":"","name":"email","qid":"3","subLabel":"","text":"E-mail","type":"control_textbox"},{"description":"","name":"howMay","qid":"4","subLabel":"","text":"How may we help you?","type":"control_textarea"},null,null,{"name":"submit7","qid":"7","text":"Submit","type":"control_button"},null,null,null,null,{"description":"","name":"phoneNumber","qid":"12","text":"Phone Number","type":"control_phone"}]); setTimeout(function() { JotForm.paymentExtrasOnTheFly([null,{"description":"","name":"name1","qid":"1","subLabel":"","text":"Name","type":"control_textbox"},null,{"description":"","name":"email","qid":"3","subLabel":"","text":"E-mail","type":"control_textbox"},{"description":"","name":"howMay","qid":"4","subLabel":"","text":"How may we help you?","type":"control_textarea"},null,null,{"name":"submit7","qid":"7","text":"Submit","type":"control_button"},null,null,null,null,{"description":"","name":"phoneNumber","qid":"12","text":"Phone Number","type":"control_phone"}]);}, 20); @media print{.form-section{display:inline!important}.form-pagebreak{display:none!important}.form-section-closed{height:auto!important}.page-section{position:initial!important}} /* Injected CSS Code */ /*PREFERENCES STYLE*/ /* NEW THEME STYLE */ /* colors */ .form-textbox, .form-textarea { color: undefined; } .rating-item input:hover+label { color: #2e69ff; } li[data-type=control_fileupload] .qq-upload-button, .until-text, .form-submit-reset { color: #2c3345; } .stageEmpty.isSmall{ color: #CAD0CF; } .rating-item label { color: #b8bdc9; } .currentDate, .pickerItem select, .appointmentCalendar .calendarDay, .calendar.popup th, .calendar.popup table tbody td, .calendar-new-header>*, .form-collapse-table { color: #2C3345; } .appointmentCalendar .dayOfWeek { color: #2e69ff; } .appointmentSlotsContainer > * { color: #2e69ff; } li[data-type=control_fileupload] .jfUpload-heading, ::placeholder, .form-dropdown.is-active, .form-dropdown:first-child, .form-spinner-input { color: #57647e; } .appointmentCalendar .calendarWeek .calendarDay.isUnavailable, .calendar tr.days td.otherDay, .calendar tr.days td:hover:not(.unselectable) { color: #CAD0CF; } span.form-sub-label, label.form-sub-label, div.form-header-group .form-subHeader, .rating-item-title.for-to > label:first-child, .rating-item-title.for-from > label:first-child, .rating-item-title .editor-container * { color: #57647E; } .form-pagebreak-back{ color: #2c3345; } .rating-item input:checked+label, .rating-item input:focus+label { color: #FFFFFF; } .clear-pad-btn { color: #57647e; } .form-textbox::placeholder, .form-dropdown:not(.time-dropdown):not(:required), .form-dropdown:not(:required), .form-dropdown:required:invalid { color: #57647e; } /* border-colors */ .form-dropdown, .form-textarea, .form-textbox, li[data-type=control_fileupload] .qq-upload-button, .rating-item label, .rating-item input:focus+label, .rating-item input:checked+label, .jf-form-buttons, .form-checkbox+label:before, .form-checkbox+span:before, .form-radio+label:before, .form-radio+span:before, .signature-pad-passive, .signature-wrapper, .appointmentCalendarContainer, .appointmentField .timezonePickerName, .appointmentDayPickerButton, .appointmentCalendarContainer .monthYearPicker .pickerItem+.pickerItem, .appointmentCalendarContainer .monthYearPicker, .appointmentCalendar .calendarDay.isActive .calendarDayEach, .appointmentCalendar .calendarDay.isToday .calendarDayEach, .appointmentCalendar .calendarDay:not(.empty):hover .calendarDayEach, .calendar.popup:before, .calendar-new-month, .form-matrix-column-headers, .form-matrix-table td, .form-matrix-table td:last-child, .form-matrix-table th, .form-matrix-table th:last-child, .form-matrix-table tr:last-child td, .form-matrix-table tr:last-child th, .form-matrix-table tr:not([role=group])+tr[role=group] th, .form-matrix-headers.form-matrix-column-headers, .isSelected .form-matrix-column-headers:nth-last-of-type(2), li[data-type=control_inline] input[type=email], li[data-type=control_inline] input[type=number], li[data-type=control_inline] input[type=tel], li[data-type=control_inline] input[type=text], .stageEmpty.isSmall { border-color: #b8bdc9; } .rating-item input:hover+label { border-color: #2e69ff; } .appointmentSlot, .form-checkbox:checked+label:before, .form-checkbox:checked+span:before, .form-checkbox:checked+span label:before, .form-radio:checked+label:before, .form-radio:checked+span:before, .form-dropdown:focus, .form-textarea:focus, .form-textbox:focus, .signature-wrapper:focus, .form-line[data-payment="true"] .form-product-item .p_checkbox .checked, .form-dropdown:hover, .form-textarea:hover, .form-textbox:hover, .signature-wrapper:hover { border-color: #2e69ff; } .calendar tr.days td:hover:not(.unselectable):after { border-color: #e5eaf4; } .form-header-group, .form-buttons-wrapper, .form-pagebreak, .form-submit-clear-wrapper, .form-pagebreak-next, .form-pagebreak-back, .form-checkbox:hover+label:before, .form-checkbox:hover+span:before, .form-radio:hover+label:before, .form-radio:hover+span:before, .divider { border-color: #F3F3FE; } .form-pagebreak-back:focus, .form-pagebreak-next:focus, .form-submit-button:focus { border-color: rgba(46, 105, 255, 1); } /* background-colors */ .form-line-active { background-color: #F1F5FF; } .form-line-error { background-color: #FFD6D6; } .form-matrix-column-headers, .form-matrix-row-headers, .form-spinner-button-container>*, .form-collapse-table, .form-collapse-table:hover, .appointmentDayPickerButton { background-color: #e5eaf4; } .calendar.popup, .calendar.popup table, .calendar.popup table tbody td:after{ background-color: #FFFFFF; } .appointmentCalendar .calendarDay.isActive .calendarDayEach, .appointmentFieldRow.forSelectedDate, .calendar.popup tr.days td.selected:after, .calendar.popup:after, .submit-button, .form-checkbox:checked+label:before, .form-checkbox:checked+span:before, .form-checkbox:checked+span label:before, .form-radio+label:after, .form-radio+span:after, .rating-item input:checked+label, .appointmentCalendar .calendarDay:after, .form-line[data-payment="true"] .form-product-item .p_checkbox .checked, .rating-item input:focus+label { background-color: #2e69ff; } .appointmentSlot.active { background-color: #2e69ff !important; } .clear-pad-btn, .appointmentCalendar .dayOfWeek, .calendar.popup th { background-color: #eef3ff !important; } .appointmentField .timezonePicker:hover+.timezonePickerName, .form-spinner-button-container>*:hover { background-color: #eef3ff; } .form-matrix-values, .form-matrix-values, .signature-wrapper, .signature-pad-passive, .rating-item label, .form-checkbox+label:before, .form-checkbox+span:before, .form-radio+label:before, .form-radio+span:before { background-color: #FFFFFF; } li[data-type=control_fileupload] .qq-upload-button { background-color: #fbfcff; } .JotFormBuilder .appContainer #app li.form-line[data-type=control_matrix].isSelected .questionLine-editButton.forRemove:after, .JotFormBuilder .appContainer #app li.form-line[data-type=control_matrix].isSelected .questionLine-editButton.forRemove:before { background-color: #FFFFFF; } .appointmentCalendarContainer, .appointmentSlot, .rating-item-title.for-to > label:first-child, .rating-item-title.for-from > label:first-child, .rating-item-title .editor-container *, .calendar-opened { background-color: transparent; } .page-section li.form-line-active[data-type="control_button"] { background-color: #F1F5FF; } .appointmentCalendar .calendarDay.isSelected:after { color: #FFFFFF; } /* shadow */ .form-dropdown:hover, .form-textarea:hover, .form-textbox:hover, .signature-wrapper:hover, .calendar.popup:before, .jSignature:hover, li[data-type=control_fileupload] .qq-upload-button-hover, .form-line[data-payment="true"] .form-product-item .p_checkbox .checked, .form-line[data-payment="true"] .form-product-item .p_checkbox:hover .select_border, .form-checkbox:hover+label:before, .form-checkbox:hover+span:before, .form-radio:hover+label:before, .form-radio:hover+span:before, .calendar.popup:before { border-color: rgba(46, 105, 255, 0.5); box-shadow: 0 0 0 2px rgba(46, 105, 255, 0.25); } .form-dropdown:focus, .form-textarea:focus, .form-textbox:focus, .signature-wrapper:focus, li[data-type=control_fileupload] .qq-upload-button-focus, .form-checkbox:focus+label:before, .form-checkbox:focus+span:before, .form-radio:focus+label:before, .form-radio:focus+span:before, .calendar.popup:before { border-color: rgba(46, 105, 255, 1); box-shadow: 0 0 0 3px rgba(46, 105, 255, 0.25); } .calendar.popup table tbody td{ box-shadow: none; } /* button colors */ .submit-button { background-color: #18BD5B; border-color: #18BD5B; } .submit-button:hover { background-color: #16AA52; border-color: #16AA52; } .form-pagebreak-next { background-color: #2e69ff; } .form-pagebreak-back { background-color: #e5e7f2; } .form-pagebreak-back:hover { background-color: #CED0DA; border-color: #CED0DA; } .form-pagebreak-next:hover { background-color: #2554CC; border-color: #2554CC; } .form-sacl-button, .form-submit-print { background-color: transparent; color: #2c3345; border-color: #b8bdc9; } .form-sacl-button:hover, .form-submit-print:hover, .appointmentSlot:not(.disabled):not(.active):hover, .appointmentDayPickerButton:hover, .rating-item input:hover+label { background-color: #96B4FF; } /* payment styles */ .form-line[data-payment=true] .form-textbox, .form-line[data-payment=true] .select-area, .form-line[data-payment=true] #coupon-input, .form-line[data-payment=true] #coupon-container input, .form-line[data-payment=true] input#productSearch-input, .form-line[data-payment=true] .form-product-category-item:after, .form-line[data-payment=true] .filter-container .dropdown-container .select-content, .form-line[data-payment=true] .form-textbox.form-product-custom_quantity, .form-line[data-payment="true"] .form-product-item .p_checkbox .select_border, .form-line[data-payment="true"] .form-product-item .form-product-container .form-sub-label-container span.select_cont, .form-line[data-payment=true] select.form-dropdown, .form-line[data-payment=true] #payment-category-dropdown .select-area, .form-line[data-payment=true] #payment-sorting-products-dropdown .select-area, .form-line[data-payment=true] .dropdown-container .select-content { border-color: #b8bdc9; border-color: undefined; } .form-line[data-payment="true"] hr, .form-line[data-payment=true] .p_item_separator, .form-line[data-payment="true"] .payment_footer.new_ui, .form-line.card-3col .form-product-item.new_ui, .form-line.card-2col .form-product-item.new_ui { border-color: #b8bdc9; border-color: undefined; } .form-line[data-payment=true] .form-product-category-item { border-color: #b8bdc9; border-color: undefined; } .form-line[data-payment=true] #coupon-input, .form-line[data-payment=true] .form-textbox.form-product-custom_quantity, .form-line[data-payment=true] input#productSearch-input, .form-line[data-payment=true] .select-area, .form-line[data-payment=true] .custom_quantity, .form-line[data-payment=true] .filter-container .select-content, .form-line[data-payment=true] .p_checkbox .select_border, .form-line[data-payment=true] #payment-category-dropdown .select-area, .form-line[data-payment=true] #payment-sorting-products-dropdown .select-area, .form-line[data-payment=true] .dropdown-container .select-content { background-color: #FFFFFF; } .form-line[data-payment=true] .form-product-category-item.title_collapsed.has_selected_product .selected-items-icon { background-color: undefined; border-color: undefined; } .form-line[data-payment=true].form-line.card-3col .form-product-item, .form-line[data-payment=true].form-line.card-2col .form-product-item { background-color: undefined; } .form-line[data-payment=true] .payment-form-table input.form-textbox, .form-line[data-payment=true] .payment-form-table input.form-dropdown, .form-line[data-payment=true] .payment-form-table .form-sub-label-container > div, .form-line[data-payment=true] .payment-form-table span.form-sub-label-container iframe, .form-line[data-type=control_square] .payment-form-table span.form-sub-label-container iframe { border-color: #b8bdc9; } /* icons */ .appointmentField .timezonePickerName:before { background-image: url(data:image/svg+xml;base64,PHN2ZyB3aWR0aD0iMTYiIGhlaWdodD0iMTYiIHZpZXdCb3g9IjAgMCAxNiAxNiIgZmlsbD0ibm9uZSIgeG1sbnM9Imh0dHA6Ly93d3cudzMub3JnLzIwMDAvc3ZnIj4KPHBhdGggZmlsbC1ydWxlPSJldmVub2RkIiBjbGlwLXJ1bGU9ImV2ZW5vZGQiIGQ9Ik0wIDcuOTYwMkMwIDMuNTY2MTcgMy41NTgyMSAwIDcuOTUyMjQgMEMxMi4zNTQyIDAgMTUuOTIwNCAzLjU2NjE3IDE1LjkyMDQgNy45NjAyQzE1LjkyMDQgMTIuMzU0MiAxMi4zNTQyIDE1LjkyMDQgNy45NTIyNCAxNS45MjA0QzMuNTU4MjEgMTUuOTIwNCAwIDEyLjM1NDIgMCA3Ljk2MDJaTTEuNTkzNzUgNy45NjAyQzEuNTkzNzUgMTEuNDc4NiA0LjQ0MzUgMTQuMzI4NCA3Ljk2MTkxIDE0LjMyODRDMTEuNDgwMyAxNC4zMjg0IDE0LjMzMDEgMTEuNDc4NiAxNC4zMzAxIDcuOTYwMkMxNC4zMzAxIDQuNDQxNzkgMTEuNDgwMyAxLjU5MjA0IDcuOTYxOTEgMS41OTIwNEM0LjQ0MzUgMS41OTIwNCAxLjU5Mzc1IDQuNDQxNzkgMS41OTM3NSA3Ljk2MDJaIiBmaWxsPSIjMTExMTExIi8+CjxwYXRoIGQ9Ik04LjM1ODA5IDMuOTgwNDdINy4xNjQwNlY4Ljc1NjU5TDExLjM0MzIgMTEuMjY0MUwxMS45NDAyIDEwLjI4NDlMOC4zNTgwOSA4LjE1OTU3VjMuOTgwNDdaIiBmaWxsPSIjMTExMTExIi8+Cjwvc3ZnPgo=); } .appointmentCalendarContainer .monthYearPicker .pickerArrow.prev:after { background-image: url(data:image/svg+xml;base64,PHN2ZyB3aWR0aD0iMTAiIGhlaWdodD0iNiIgdmlld0JveD0iMCAwIDEwIDYiIGZpbGw9Im5vbmUiIHhtbG5zPSJodHRwOi8vd3d3LnczLm9yZy8yMDAwL3N2ZyI+CjxwYXRoIGQ9Ik04LjU5NzgyIDUuMzMyNzNDOC45MzMxMiA1LjYzNjI3IDkuNDM5MzkgNS42Mjk2OSA5Ljc1NjEzIDUuMzEyNzhDMTAuMDgxMyA0Ljk4NzQ1IDEwLjA4MTMgNC40NTk2MyA5Ljc1NjEzIDQuMTM0M0M5LjYwOTA0IDMuOTk2MzUgOS42MDkwMyAzLjk5NjM1IDkuMDg5NDkgMy41MTExOEM4LjQzNzQyIDIuOTAyMTggOC40Mzc0MyAyLjkwMjE4IDcuNjU1MTEgMi4xNzE1NkM2LjA4OTU2IDAuNzA5NDQ3IDYuMDg5NTYgMC43MDk0NDYgNS41Njc3MyAwLjIyMjEwMUM1LjI0MTA0IC0wLjA3NDUwNjcgNC43NTA4NSAtMC4wNzM1MDMgNC40MzIzNSAwLjIyMTkyOUwwLjI2MjU0IDQuMTE0MjRDLTAuMDgwNTQ1OSA0LjQ1NTQ1IC0wLjA4NzE3MTEgNC45ODM5NyAwLjI0MTQ2OCA1LjMxMjc4QzAuNTU5NTU4IDUuNjMxMDUgMS4wNjk3NSA1LjYzNjY4IDEuMzk3MDMgNS4zMzI2Mkw0Ljk5ODkxIDEuOTcxMzFMOC41OTc4MiA1LjMzMjczWiIgZmlsbD0iI0NGQ0ZDRiIvPgo8L3N2Zz4K); } .appointmentCalendarContainer .monthYearPicker .pickerArrow.next:after { background-image: url(data:image/svg+xml;base64,PHN2ZyB3aWR0aD0iMTAiIGhlaWdodD0iNiIgdmlld0JveD0iMCAwIDEwIDYiIGZpbGw9Im5vbmUiIHhtbG5zPSJodHRwOi8vd3d3LnczLm9yZy8yMDAwL3N2ZyI+CjxwYXRoIGQ9Ik0xLjQwMjE4IDAuMjIzNDk3QzEuMDY2ODcgLTAuMDgwMTAyOCAwLjU2MDYwMiAtMC4wNzM1MDI4IDAuMjQzODY5IDAuMjQzMzk3Qy0wLjA4MTI4OTggMC41Njg2OTcgLTAuMDgxMjg5OCAxLjA5NjYgMC4yNDM4NjkgMS40MjE5QzAuMzkwOTU2IDEuNTU5OCAwLjM5MDk2NiAxLjU1OTggMC45MTA1MSAyLjA0NUMxLjU2MjU3IDIuNjU0IDEuNTYyNTYgMi42NTQgMi4zNDQ4OCAzLjM4NDZDMy45MTA0NCA0Ljg0NjcgMy45MTA0MyA0Ljg0NjcgNC40MzIyNyA1LjMzNDFDNC43NTg5NSA1LjYzMDcgNS4yNDkxNSA1LjYyOTcgNS41Njc2NCA1LjMzNDNMOS43Mzc0NiAxLjQ0MkMxMC4wODA1IDEuMTAwNyAxMC4wODcxIDAuNTcyMTk3IDkuNzU4NTMgMC4yNDMzOTdDOS40NDA0NCAtMC4wNzQ5MDI4IDguOTMwMjQgLTAuMDgwNTAyOCA4LjYwMjk3IDAuMjIzNTk3TDUuMDAxMDggMy41ODQ5TDEuNDAyMTggMC4yMjM0OTdaIiBmaWxsPSIjQ0ZDRkNGIi8+Cjwvc3ZnPgo=); } .appointmentField .timezonePickerName:after { background-image: url(data:image/svg+xml;base64,PHN2ZyB3aWR0aD0iMTAiIGhlaWdodD0iNiIgdmlld0JveD0iMCAwIDEwIDYiIGZpbGw9Im5vbmUiIHhtbG5zPSJodHRwOi8vd3d3LnczLm9yZy8yMDAwL3N2ZyI+CjxwYXRoIGQ9Ik0wLjA1Mjk5IDAuMjM2NTcyQzAuMDExMzU0NiAwLjMwNzc4NSAtMC4wMDYzMDI4MiAwLjM4NzUzNCAwLjAwMTk5OTIzIDAuNDY2ODdDMC4wMTAzMDEzIDAuNTQ2MjA2IDAuMDQ0MjM0MyAwLjYyMTk4OSAwLjA5OTk5MDEgMC42ODU3MTVMNC41OTk5OSA1LjgyODU3QzQuNjQ2NTcgNS44ODE4IDQuNzA2OTYgNS45MjUgNC43NzYzOSA1Ljk1NDc1QzQuODQ1ODIgNS45ODQ1MSA0LjkyMjM3IDYgNC45OTk5OSA2QzUuMDc3NjIgNiA1LjE1NDE3IDUuOTg0NTEgNS4yMjM2IDUuOTU0NzVDNS4yOTMwMyA1LjkyNSA1LjM1MzQyIDUuODgxOCA1LjQgNS44Mjg1N0w5LjkgMC42ODU3MTRDOS45NjQ5MSAwLjYxMTUzIDEwIDAuNTIxMzAxIDEwIDAuNDI4NTcxQzkuOTk5NzEgMC4zNjE5MzggOS45ODE1NyAwLjI5NjI1MiA5Ljk0NyAwLjIzNjU3MUM5LjkwNTQzIDAuMTY1NDc0IDkuODQxNjEgMC4xMDU2OTEgOS43NjI2NyAwLjA2MzkxMTVDOS42ODM3MyAwLjAyMjEzMTcgOS41OTI3OCAyLjYwNjg5ZS0wNiA5LjUgLTUuNzYzMDNlLTA4TDAuNDk5OTkgMy4zNTc3M2UtMDdDMC40MDcyMTIgMy4wMDg0ZS0wNiAwLjMxNjI2NCAwLjAyMjEzMjEgMC4yMzczMjEgMC4wNjM5MTE5QzAuMTU4Mzc5IDAuMTA1NjkyIDAuMDk0NTU0NyAwLjE2NTQ3NCAwLjA1Mjk5IDAuMjM2NTcyVjAuMjM2NTcyWiIgZmlsbD0iIzExMTExMSIvPgo8L3N2Zz4K); width: 11px; } li[data-type=control_datetime] [data-wrapper-react=true].extended>div+.form-sub-label-container .form-textbox:placeholder-shown, li[data-type=control_datetime] [data-wrapper-react=true]:not(.extended) .form-textbox:not(.time-dropdown):placeholder-shown, .appointmentCalendarContainer .currentDate { background-image: url(data:image/svg+xml;base64,PHN2ZyB3aWR0aD0iMTciIGhlaWdodD0iMTYiIHZpZXdCb3g9IjAgMCAxNyAxNiIgZmlsbD0ibm9uZSIgeG1sbnM9Imh0dHA6Ly93d3cudzMub3JnLzIwMDAvc3ZnIj4KPHBhdGggZD0iTTE1Ljk0ODkgNVYxNS4wMjZDMTUuOTQ4OSAxNS41NjM5IDE1LjUwMjYgMTYgMTQuOTUyMSAxNkgwLjk5NjgwNUMwLjQ0NjI4NSAxNiAwIDE1LjU2MzkgMCAxNS4wMjZWNUgxNS45NDg5Wk00LjE5MjQ1IDExLjQxNjdIMi4zNzQ3NEwyLjI4NTE1IDExLjQyNDdDMi4xMTA3OCAxMS40NTY1IDEuOTY4MDEgMTEuNTc5MiAxLjkwNzUyIDExLjc0MjJMMS44ODQzNyAxMS44MjY4TDEuODc2MzQgMTEuOTE2N1YxMy42NjY3TDEuODg0MzcgMTMuNzU2NUMxLjkxNjAyIDEzLjkzMTUgMi4wMzg0IDE0LjA3NDcgMi4yMDA4MyAxNC4xMzU0TDIuMjg1MTUgMTQuMTU4NkwyLjM3NDc0IDE0LjE2NjdINC4xOTI0NUw0LjI4MjAzIDE0LjE1ODZDNC40NTY0MSAxNC4xMjY5IDQuNTk5MTggMTQuMDA0MSA0LjY1OTY3IDEzLjg0MTFMNC42ODI4MiAxMy43NTY1TDQuNjkwODUgMTMuNjY2N1YxMS45MTY3TDQuNjgyODIgMTEuODI2OEM0LjY1MTE3IDExLjY1MTkgNC41Mjg3OSAxMS41MDg2IDQuMzY2MzUgMTEuNDQ3OUw0LjI4MjAzIDExLjQyNDdMNC4xOTI0NSAxMS40MTY3Wk04Ljg4MzI5IDExLjQxNjdINy4wNjU1OUw2Ljk3NiAxMS40MjQ3QzYuODAxNjIgMTEuNDU2NSA2LjY1ODg1IDExLjU3OTIgNi41OTgzNyAxMS43NDIyTDYuNTc1MjIgMTEuODI2OEw2LjU2NzE5IDExLjkxNjdWMTMuNjY2N0w2LjU3NTIyIDEzLjc1NjVDNi42MDY4NyAxMy45MzE1IDYuNzI5MjUgMTQuMDc0NyA2Ljg5MTY4IDE0LjEzNTRMNi45NzYgMTQuMTU4Nkw3LjA2NTU5IDE0LjE2NjdIOC44ODMyOUw4Ljk3Mjg4IDE0LjE1ODZDOS4xNDcyNiAxNC4xMjY5IDkuMjkwMDMgMTQuMDA0MSA5LjM1MDUxIDEzLjg0MTFMOS4zNzM2NyAxMy43NTY1TDkuMzgxNyAxMy42NjY3VjExLjkxNjdMOS4zNzM2NyAxMS44MjY4QzkuMzQyMDIgMTEuNjUxOSA5LjIxOTY0IDExLjUwODYgOS4wNTcyIDExLjQ0NzlMOC45NzI4OCAxMS40MjQ3TDguODgzMjkgMTEuNDE2N1pNNC4xOTI0NSA2LjgzMzMzSDIuMzc0NzRMMi4yODUxNSA2Ljg0MTM5QzIuMTEwNzggNi44NzMxNCAxLjk2ODAxIDYuOTk1OTEgMS45MDc1MiA3LjE1ODg3TDEuODg0MzcgNy4yNDM0NkwxLjg3NjM0IDcuMzMzMzNWOS4wODMzM0wxLjg4NDM3IDkuMTczMjFDMS45MTYwMiA5LjM0ODE1IDIuMDM4NCA5LjQ5MTM3IDIuMjAwODMgOS41NTIwNUwyLjI4NTE1IDkuNTc1MjhMMi4zNzQ3NCA5LjU4MzMzSDQuMTkyNDVMNC4yODIwMyA5LjU3NTI4QzQuNDU2NDEgOS41NDM1MyA0LjU5OTE4IDkuNDIwNzUgNC42NTk2NyA5LjI1NzhMNC42ODI4MiA5LjE3MzIxTDQuNjkwODUgOS4wODMzM1Y3LjMzMzMzTDQuNjgyODIgNy4yNDM0NkM0LjY1MTE3IDcuMDY4NTIgNC41Mjg3OSA2LjkyNTI5IDQuMzY2MzUgNi44NjQ2MUw0LjI4MjAzIDYuODQxMzlMNC4xOTI0NSA2LjgzMzMzWk04Ljg4MzI5IDYuODMzMzNINy4wNjU1OUw2Ljk3NiA2Ljg0MTM5QzYuODAxNjIgNi44NzMxNCA2LjY1ODg1IDYuOTk1OTEgNi41OTgzNyA3LjE1ODg3TDYuNTc1MjIgNy4yNDM0Nkw2LjU2NzE5IDcuMzMzMzNWOS4wODMzM0w2LjU3NTIyIDkuMTczMjFDNi42MDY4NyA5LjM0ODE1IDYuNzI5MjUgOS40OTEzNyA2Ljg5MTY4IDkuNTUyMDVMNi45NzYgOS41NzUyOEw3LjA2NTU5IDkuNTgzMzNIOC44ODMyOUw4Ljk3Mjg4IDkuNTc1MjhDOS4xNDcyNiA5LjU0MzUzIDkuMjkwMDMgOS40MjA3NSA5LjM1MDUxIDkuMjU3OEw5LjM3MzY3IDkuMTczMjFMOS4zODE3IDkuMDgzMzNWNy4zMzMzM0w5LjM3MzY3IDcuMjQzNDZDOS4zNDIwMiA3LjA2ODUyIDkuMjE5NjQgNi45MjUyOSA5LjA1NzIgNi44NjQ2MUw4Ljk3Mjg4IDYuODQxMzlMOC44ODMyOSA2LjgzMzMzWk0xMy41NzQxIDYuODMzMzNIMTEuNzU2NEwxMS42NjY4IDYuODQxMzlDMTEuNDkyNSA2Ljg3MzE0IDExLjM0OTcgNi45OTU5MSAxMS4yODkyIDcuMTU4ODdMMTEuMjY2MSA3LjI0MzQ2TDExLjI1OCA3LjMzMzMzVjkuMDgzMzNMMTEuMjY2MSA5LjE3MzIxQzExLjI5NzcgOS4zNDgxNSAxMS40MjAxIDkuNDkxMzcgMTEuNTgyNSA5LjU1MjA1TDExLjY2NjggOS41NzUyOEwxMS43NTY0IDkuNTgzMzNIMTMuNTc0MUwxMy42NjM3IDkuNTc1MjhDMTMuODM4MSA5LjU0MzUzIDEzLjk4MDkgOS40MjA3NSAxNC4wNDE0IDkuMjU3OEwxNC4wNjQ1IDkuMTczMjFMMTQuMDcyNSA5LjA4MzMzVjcuMzMzMzNMMTQuMDY0NSA3LjI0MzQ2QzE0LjAzMjkgNy4wNjg1MiAxMy45MTA1IDYuOTI1MjkgMTMuNzQ4IDYuODY0NjFMMTMuNjYzNyA2Ljg0MTM5TDEzLjU3NDEgNi44MzMzM1oiIGZpbGw9IiM1ODY1N0MiLz4KPHBhdGggZD0iTTEzLjA1MjIgMS4xMjVIMTUuMDQ1OEMxNS41OTYzIDEuMTI1IDE2LjA0MjYgMS42MDA3IDE2LjA0MjYgMi4xODc1VjRIMC4wOTM3NVYyLjE4NzVDMC4wOTM3NSAxLjYwMDcgMC41NDAwMzUgMS4xMjUgMS4wOTA1NiAxLjEyNUgzLjA4NDE3VjEuMDYyNUMzLjA4NDE3IDAuNDc1Njk3IDMuNTMwNDUgMCA0LjA4MDk3IDBDNC42MzE0OSAwIDUuMDc3NzggMC40NzU2OTcgNS4wNzc3OCAxLjA2MjVWMS4xMjVIMTEuMDU4NlYxLjA2MjVDMTEuMDU4NiAwLjQ3NTY5NyAxMS41MDQ5IDAgMTIuMDU1NCAwQzEyLjYwNTkgMCAxMy4wNTIyIDAuNDc1Njk3IDEzLjA1MjIgMS4wNjI1VjEuMTI1WiIgZmlsbD0iIzU4NjU3QyIvPgo8L3N2Zz4K); } .form-star-rating-star.Stars { background-image: url(data:image/png;base64,iVBORw0KGgoAAAANSUhEUgAAAKAAAAAeCAYAAACrDxUoAAAACXBIWXMAAAsTAAALEwEAmpwYAAAAAXNSR0IArs4c6QAAAARnQU1BAACxjwv8YQUAAAvDSURBVHgB7VtLbBvXFb1vZjgiRdEmlcKWYQWlDLuo0QamC7SRW7sdpg0QO4uiaLsoGsBysq/RbQtEYpCkyMpJurY+aLpogtbdSAaapGTzge1kYW4KJ0g/TGpbNm2JlEiK5Pxe7x1xBIqixuIbkkKbHGDA+b13+O6cOe/NuzMAX+AL/K/i3Q8+Ov/etY8uwC4h/9bo+XtvP/y55b/71uil3Yx/6cTJ86snTvniZyCI9Ic3tKCkpGnd1M3kqRNHM9BHLL45qinqcIN/OXng8ZsZ6CMcfoXaz8A0jf7z/+XghCSxmX/F0rsS/8LJk1pg30ia47p5+04ydvW9DAhAAkEonE3G9kYgFo0AyGwS+gyZwWRo/xmghdahzyDOcGQYwpHYrvBL0jrnrsWfw6T6zNMwgIuf9gsJkNxPkWUtMhSCSDgEtP7ulRsa9AnkPiwwrKmxR4EWWqd90Cc4/LKihUIRoIXJgf7yo/sFQ3vitL4b8Sf3k/aPaIEzp4EWdmBEK4yf1EAAQgJ03c9Fv+9C1/1c9NsFXfdz0W8XJPcjThd9j3/D/Vz4ccGOBdjsfi76eRc2u5+Lfrpgs/u56KcLuu4ny4GNff2Mf7P7ufDjgh0LsNX9XPTrLmx1Pxf9csFW93PRLxdsdT8XfYt/i/u5EHXBjgTYzv1c9OMubOd+Lvrhgu3cz0U/XLCd+7noR/zbuZ8LURfcsQDT169H0f0utHM/F+5dmL5yIw5dxr/T0ajE4EI793PhuuBieiQOPeJv534uXBfsBT/VuZ37uehl/AuaFpVsuNDO/Vy4LlgYH4/DDrFpHpBEBkY4DmAlFGB78WCCry9RmbF4ZGgQHort8axwqbAKK6UKrvEiVp/FOnIW55/aMs+CreQgUMkljx8vtitLFzmM/JYMCZmzvTawBAOeAMajjA3G1eFHYfDAjz351xb/CPX7GWoYcWSxjhwnfmZlA7aUqyD/WLLYOT/I8eBgBCJ7vuTJX169D2uVFd/8YLM4Y+zLxI91xYFJURLfYDi6cX5+8Z9gfv3v0K34k8hA1+O4mlC4tJdLHK89SwBnUWkoHCeXGzj/C/BC/dVXQf/DG7RaxCBk8X9g+xnysyxYVg5UNRfLZDb4HQG+++HHkxikCRKZJEugBgIQUGQ8NwASY84vbXcCw7RwgtbC9hhgWlZj2wTdMJ3g2DZLfW/8qy/TuXffHsWxA58gkTF5EOTQQZDUYZCDoyDJofXtwEOd0INtLIGtL4NVvQVWY93Zrt10xGFznhp5/NZmfhQZQ5sJBFTkDYASGMD2S/irQrtuzwuWZeBigmnUnV+btrH9pql78suy4vDS/6DfgLLOTdutaCdAkfiXvn1yEm+UCRIZRIZAPnwYu9MDIB85AqxpuxPwxUWw79wB65N/gI3r7raN24gi6i2198r7LyvrZ3MNxxDxfQ9FoVsgwdISCqpbjt1bKkZLleoPcdUJAOOgBWLj8fDoU9AtkGBpUcJHthyr3HwtahSubeIfwLHVnug+6BZINLSo6tbx8moxH61XSz3l7yT+HPnVJ5+IB3/9K+gWHAHTcvz4lmO1F16MGvOXHX7ntjItfq5cqWYLKyXoNYgDG58lTnefZZjn9MK1bPXuZeg1asihL1/LEmczf61aylZKBeg1iKO2VmrDX871g79t/DnGf+Fytn5xBnqN+vQMEBdx0rYjwOSJozkzUE0WVso9FSHVTRzERZzu/gOn7+RUWUnW8gs9FSGJr3p3IbtWLieJs5W/Ul7uqQip7kppuS2/bRjIX+ipCLeLf+zq1ZytKsn69HRPRUjiq1+czhIXcdK+LQ8hihFKD4VDiW52xwS0/fU7jxq/3SA4HY/qlpnGKZVEN7tjQuU/vwe9cNW5+GM/KnryB0ORRDe7QwJ2u47z7YQ/PDSc8HradeE1BmzFjuJPT7o6xv/M6UQ3u2NC7YXfoPMtrIuv6SFk08iW/hj9wXK5eim/VIRuodH4tFfjCbFkrkhOpBc+uITjNOgWSHz14tW018Vv5sfu8BIJpluguqrVUman/N124kb8Mw+MPwqDBILjsz/jOA26BRKfMb+QaRUfYdvXsd65dmMGp10m/DihbdvOtMBqeW32u48ePddJ2btvHZxRY+MTfpyQW2uwdvsS6MUrs/t/cKtjfpz0nfDjhBzbX8JpmVp1dQ75J3ZaznXCUDiaiOzZ/un/QQ7YFP85jP8EdICVE9+ZVZ88c9aPE/JyGeqv/Bb0+fk5fOKdaHfOthPRJJgSCsePE4qKj0CCwS5z1o8Tri3+SUh8Lj8KZ9aPE4qIj+A6YbVSRCdcBlGIio9AgtHnF+b8OGH9lVc9xUfwzIRYNqRqdR1EQWUtFVIgCNuwUmblExCFWf4E6wj44jf0KojC0GvEPwUCIBHaHH6p++BvxH8KBGFza8q6fh1EYWJZqsPrHO9UnAJxzC+CKBjmrsCQxftwRYl3OgG9iZ8msWXDH7+sgCgwk+GLH5MAUSbtbvzZyAiIgg0NoYtJnvyeApQsnhhQO8sANGMAMyqSbWsgCEpDycGDIArKpNgMNBAE8VM2QhRU1g8/ZksSlAkRhd/40/WXjhwBUVAmRVKY5nWOtwNKUlxRxO9ASuFhBOIgCkoNqsMgCgVTeKiiOIgC+WUfDkgpPD/86IDHZB83QFfi78MBpSOHnTo8z3nAwWOUFxYFlZVAOgaCIH45NOpxBm8s7UFlJWC++P06oB9+bBsOgcRvAL/xxxHEMfkr/hwQ04ye/Nu2Lk2DTwOwC956Cj3e0xsXuHAJk+SYR2btXtNaL8sS6es3cI7xKHQCnIoAwzITSnCrALlVgdr9d6C+lOY0zlOj4yy0/wlonVWiLpje5lm8HMdsQw46gcsfULYKkKZX6I0XfEp1XhLA6RpoN3FMZYkfBNCYimk7BCB+zJo465/dzjvvAnrFH0TBoW0XTNMr9MaL8cbrzjhPOX0GBp7ZOtHglGXe7fdywCiKi5aNHSQ8Sudgo3lxpTyjG/ahWt08tFwszdK+UmVtc+VYFsfBNAiNQ+eIooVFSWAuSHiUqlv5OMWr+fkZq1Y6ZFbyh9buzM+ufDzF64Vr0OyIVBYXcX5sf/NbKM6FxwnipfynUC4vzZq6PmbUamOl1aU52oeZjk0VMKf9UhRvgDh0iJppJlq7X5c/f28JCrV9s8vyz8cw/mMY/zkS4nbxRwOIQ4egrAiKK+o8SLj8NK+HqbrKT34K+vTFWXOlOGbcujlWv3hxjvYZC5vTqFSW6vB6P3B7fzeDCbXJ/cjxUHwYA57B7PVzLd+hnktfuZHK3y9OYq7xbGzvEIuEB50DQXobo1YnG85BB6ALoA6NNbY41O//Dar5BW5b1Qzn8NyBx29lmvkXL1up8me/m8R88tngvjNsIPYtCoHzNozEs0L8AwPBjW1yvDWck7O4TfypFv6JxcsjU0Xj7lSgvHwWU2lA7w4SAireBKzUMT89Abvjz2bHLUuPZO4Hnkp989TPMgB/xaMvOfwY/ymM/1Qj/uA3/oDtl752eGNTf/0NFN008NVyxsL2x66+n2k6ewJFNmU9/8IUnnNWffppcN+alr9xHPg7723Lv60A3SdguquwUdw0rXbC20Ajue0I8d7SyjSW0UiIAUWBslUfgw7hPgGTq6GouKUvN4TX/gPwRnLfEWL15mvTWEYjIUqBYdAtJsRP3R+5GnZ33LSMnfA7QixZ+RlMp2kkRBnbX6t1zs+Ba/QETI5HwqtJD2eK6unUI6deygDMbzm/EX9HiBj/mUb8QTT+7hMwuVqdhHf7TkN47T9Ab7xc4AjRfv7FGRSiRkKkaRzO7W35PUe4NMbDH0/htaIRiMfo2wQMxLO4rskKE0ps1pfomoPnhW9FQwiPLb4JGgrxWSyv4WBaiL9aWeFrYvxJ+jaktJKfFOVHziKN8xrtTz38fXKc9x9YrhH/ZCP+9JGQcPwNdD2Dg6fwWtEQYpK+DUEhTuKdrOFcplhi+0oXvi3wU4fI2Kmbdfw/8PuJfyffdojW8V+eSSW+hhteKQAAAABJRU5ErkJggg==) !important; } .signature-pad-passive, .signature-placeholder:after { background-image: url(data:image/svg+xml;base64,PHN2ZyB3aWR0aD0iMTk4IiBoZWlnaHQ9IjQwIiB2aWV3Qm94PSIwIDAgMTk4IDQwIiBmaWxsPSJub25lIiB4bWxucz0iaHR0cDovL3d3dy53My5vcmcvMjAwMC9zdmciPgo8cGF0aCBkPSJNNzQuMTA0NCA2LjM0NTA4SDc1LjU4NTlDNzUuNTQxMiA0LjcxNDQgNzQuMDk5NCAzLjUzMTE2IDcyLjAzMTIgMy41MzExNkM2OS45ODc5IDMuNTMxMTYgNjguNDIxOSA0LjY5OTQ4IDY4LjQyMTkgNi40NTQ0NkM2OC40MjE5IDcuODcxMzYgNjkuNDM2MSA4LjcwMTYyIDcxLjA3MTcgOS4xNDQwOUw3Mi4yNzQ5IDkuNDcyMjFDNzMuMzYzNiA5Ljc2MDU2IDc0LjIwMzggMTAuMTE4NSA3NC4yMDM4IDExLjAyMzNDNzQuMjAzOCAxMi4wMTc3IDczLjI1NDMgMTIuNjczOSA3MS45NDY3IDEyLjY3MzlDNzAuNzYzNSAxMi42NzM5IDY5Ljc3OTEgMTIuMTQ2OSA2OS42ODk2IDExLjAzODNINjguMTQ4NEM2OC4yNDc5IDEyLjg4MjcgNjkuNjc0NyAxNC4wMjEyIDcxLjk1NjcgMTQuMDIxMkM3NC4zNDggMTQuMDIxMiA3NS43MjUxIDEyLjc2MzQgNzUuNzI1MSAxMS4wMzgzQzc1LjcyNTEgOS4yMDM3NSA3NC4wODk1IDguNDkyODEgNzIuNzk2OSA4LjE3NDYzTDcxLjgwMjYgNy45MTYxQzcxLjAwNzEgNy43MTIyNyA2OS45NDgyIDcuMzM5NCA2OS45NTMxIDYuMzY0OTdDNjkuOTUzMSA1LjQ5OTkxIDcwLjc0MzYgNC44NTg1OCA3MS45OTY0IDQuODU4NThDNzMuMTY0OCA0Ljg1ODU4IDczLjk5NSA1LjQwNTQ1IDc0LjEwNDQgNi4zNDUwOFoiIGZpbGw9IiM4Nzk1QUIiLz4KPHBhdGggZD0iTTc3LjQ0MTYgMTMuODUyMkg3OC45MjgxVjYuMjE1ODJINzcuNDQxNlYxMy44NTIyWk03OC4xOTIzIDUuMDM3NTVDNzguNzA0NCA1LjAzNzU1IDc5LjEzMTkgNC42Mzk4MyA3OS4xMzE5IDQuMTUyNjFDNzkuMTMxOSAzLjY2NTM5IDc4LjcwNDQgMy4yNjI3IDc4LjE5MjMgMy4yNjI3Qzc3LjY3NTIgMy4yNjI3IDc3LjI1MjcgMy42NjUzOSA3Ny4yNTI3IDQuMTUyNjFDNzcuMjUyNyA0LjYzOTgzIDc3LjY3NTIgNS4wMzc1NSA3OC4xOTIzIDUuMDM3NTVaIiBmaWxsPSIjODc5NUFCIi8+CjxwYXRoIGQ9Ik04NC4xMjk2IDE2Ljg2Qzg2LjA3MzUgMTYuODYgODcuNTc0OSAxNS45NzAxIDg3LjU3NDkgMTQuMDIxMlY2LjIxNTgySDg2LjExODNWNy40NTM3NUg4Ni4wMDg5Qzg1Ljc0NTQgNi45ODE0NSA4NS4yMTg0IDYuMTE2MzkgODMuNzk2NSA2LjExNjM5QzgxLjk1MjEgNi4xMTYzOSA4MC41OTQ4IDcuNTczMDYgODAuNTk0OCAxMC4wMDQyQzgwLjU5NDggMTIuNDQwMyA4MS45ODE5IDEzLjczNzggODMuNzg2NiAxMy43Mzc4Qzg1LjE4ODYgMTMuNzM3OCA4NS43MzA1IDEyLjk0NzQgODUuOTk4OSAxMi40NjAxSDg2LjA5MzRWMTMuOTYxNkM4Ni4wOTM0IDE1LjEzOTggODUuMjczMSAxNS42NjE4IDg0LjE0NDUgMTUuNjYxOEM4Mi45MDY2IDE1LjY2MTggODIuNDI0NCAxNS4wNDA0IDgyLjE2MDkgMTQuNjE3OEw4MC44ODMyIDE1LjE0NDhDODEuMjg1OSAxNi4wNjQ1IDgyLjMwNSAxNi44NiA4NC4xMjk2IDE2Ljg2Wk04NC4xMTQ3IDEyLjUwNDlDODIuNzg3MyAxMi41MDQ5IDgyLjA5NjIgMTEuNDg1NyA4Mi4wOTYyIDkuOTg0MjlDODIuMDk2MiA4LjUxNzY3IDgyLjc3MjQgNy4zNzkxNyA4NC4xMTQ3IDcuMzc5MTdDODUuNDEyMyA3LjM3OTE3IDg2LjEwODMgOC40MzgxMiA4Ni4xMDgzIDkuOTg0MjlDODYuMTA4MyAxMS41NjAzIDg1LjM5NzQgMTIuNTA0OSA4NC4xMTQ3IDEyLjUwNDlaIiBmaWxsPSIjODc5NUFCIi8+CjxwYXRoIGQ9Ik05MS4wNTUgOS4zMTgwOUM5MS4wNTUgOC4xMDAwNSA5MS44MDA4IDcuNDA0MDMgOTIuODM0OSA3LjQwNDAzQzkzLjg0NDEgNy40MDQwMyA5NC40NTU2IDguMDY1MjUgOTQuNDU1NiA5LjE3MzkyVjEzLjg1MjJIOTUuOTQyMVY4Ljk5NDk0Qzk1Ljk0MjEgNy4xMDU3NCA5NC45MDMxIDYuMTE2MzkgOTMuMzQyIDYuMTE2MzlDOTIuMTkzNSA2LjExNjM5IDkxLjQ0MjggNi42NDgzNSA5MS4wODk4IDcuNDU4NzJIOTAuOTk1NFY2LjIxNTgySDg5LjU2ODVWMTMuODUyMkg5MS4wNTVWOS4zMTgwOVoiIGZpbGw9IiM4Nzk1QUIiLz4KPHBhdGggZD0iTTEwMS43NiAxMy44NTIySDEwMy4yOTZWOS40MTI1NUgxMDguMzcyVjEzLjg1MjJIMTA5LjkxNFYzLjY3MDM3SDEwOC4zNzJWOC4wOTUwOEgxMDMuMjk2VjMuNjcwMzdIMTAxLjc2VjEzLjg1MjJaIiBmaWxsPSIjODc5NUFCIi8+CjxwYXRoIGQ9Ik0xMTUuMzIzIDE0LjAwNjNDMTE2Ljk4OCAxNC4wMDYzIDExOC4xNjYgMTMuMTg2IDExOC41MDQgMTEuOTQzMUwxMTcuMDk3IDExLjY4OTVDMTE2LjgyOSAxMi40MTA0IDExNi4xODMgMTIuNzc4MyAxMTUuMzM4IDEyLjc3ODNDMTE0LjA2NSAxMi43NzgzIDExMy4yMSAxMS45NTMgMTEzLjE3IDEwLjQ4MTRIMTE4LjU5OVY5Ljk1NDQ2QzExOC41OTkgNy4xOTUyMiAxMTYuOTQ4IDYuMTE2MzkgMTE1LjIxOCA2LjExNjM5QzExMy4wOSA2LjExNjM5IDExMS42ODggNy43MzcxMyAxMTEuNjg4IDEwLjA4MzdDMTExLjY4OCAxMi40NTUyIDExMy4wNyAxNC4wMDYzIDExNS4zMjMgMTQuMDA2M1pNMTEzLjE3NSA5LjM2NzgxQzExMy4yMzUgOC4yODQgMTE0LjAyIDcuMzQ0MzcgMTE1LjIyOCA3LjM0NDM3QzExNi4zODIgNy4zNDQzNyAxMTcuMTM3IDguMTk5NDkgMTE3LjE0MiA5LjM2NzgxSDExMy4xNzVaIiBmaWxsPSIjODc5NUFCIi8+CjxwYXRoIGQ9Ik0xMjAuMjQ4IDEzLjg1MjJIMTIxLjczNVY5LjE4ODgzQzEyMS43MzUgOC4xODk1NCAxMjIuNTA1IDcuNDY4NjYgMTIzLjU1OSA3LjQ2ODY2QzEyMy44NjggNy40Njg2NiAxMjQuMjE2IDcuNTIzMzUgMTI0LjMzNSA3LjU1ODE1VjYuMTM2MjdDMTI0LjE4NiA2LjExNjM5IDEyMy44OTIgNi4xMDE0NyAxMjMuNzAzIDYuMTAxNDdDMTIyLjgwOSA2LjEwMTQ3IDEyMi4wNDMgNi42MDg1OCAxMjEuNzY1IDcuNDI4ODlIMTIxLjY4NVY2LjIxNTgySDEyMC4yNDhWMTMuODUyMloiIGZpbGw9IiM4Nzk1QUIiLz4KPHBhdGggZD0iTTEyOC42MzkgMTQuMDA2M0MxMzAuMzA1IDE0LjAwNjMgMTMxLjQ4MyAxMy4xODYgMTMxLjgyMSAxMS45NDMxTDEzMC40MTQgMTEuNjg5NUMxMzAuMTQ1IDEyLjQxMDQgMTI5LjQ5OSAxMi43NzgzIDEyOC42NTQgMTIuNzc4M0MxMjcuMzgxIDEyLjc3ODMgMTI2LjUyNiAxMS45NTMgMTI2LjQ4NiAxMC40ODE0SDEzMS45MTVWOS45NTQ0NkMxMzEuOTE1IDcuMTk1MjIgMTMwLjI2NSA2LjExNjM5IDEyOC41MzUgNi4xMTYzOUMxMjYuNDA3IDYuMTE2MzkgMTI1LjAwNSA3LjczNzEzIDEyNS4wMDUgMTAuMDgzN0MxMjUuMDA1IDEyLjQ1NTIgMTI2LjM4NyAxNC4wMDYzIDEyOC42MzkgMTQuMDA2M1pNMTI2LjQ5MSA5LjM2NzgxQzEyNi41NTEgOC4yODQgMTI3LjMzNiA3LjM0NDM3IDEyOC41NDUgNy4zNDQzN0MxMjkuNjk4IDcuMzQ0MzcgMTMwLjQ1NCA4LjE5OTQ5IDEzMC40NTkgOS4zNjc4MUgxMjYuNDkxWiIgZmlsbD0iIzg3OTVBQiIvPgo8cGF0aCBkPSJNMSAzNi4wMjI5QzEyLjI0NjEgMzkuMjIwNSAyMy4xODIgMzUuMDMyOCAzMi41MDg0IDI4Ljg1MTFDMzcuNDQwNCAyNS41ODIyIDQyLjMzNDEgMjEuNjY4NyA0NS4zMzI5IDE2LjUxMDFDNDYuNTI4MyAxNC40NTM5IDQ3Ljk4OTMgMTAuODg0NCA0NC4yMjcxIDEwLjg1MjhDNDAuMTMzNyAxMC44MTgzIDM3LjA4NjQgMTQuNTE0MiAzNS41NTg4IDE3Ljg3NDRDMzMuMzY4MSAyMi42OTMzIDMzLjI5MSAyOC40MDA0IDM1Ljk2NTYgMzMuMDQ0MUMzOC40OTcxIDM3LjQzOTYgNDIuNzQ0NSAzOS41MTg0IDQ3LjgxMTQgMzguNjYzOUM1My4xMDM3IDM3Ljc3MTMgNTcuNzMwNCAzNC4xNTYyIDYxLjU3NjUgMzAuNjc4NUM2Mi45OTMgMjkuMzk3NiA2NC4zMjA5IDI4LjA0NzUgNjUuNTQyIDI2LjU4NTdDNjUuNjg0MiAyNi40MTU1IDY2LjE4NDIgMjUuNTc5OCA2Ni41MDggMjUuNTIxOEM2Ni42Mjg0IDI1LjUwMDIgNjYuODA2NCAyOS4xNjQ1IDY2LjgzODUgMjkuMzY0M0M2Ny4xMjU1IDMxLjE1NDMgNjguMDI5NCAzMy4xNzA2IDcwLjE0MzEgMzMuMjMxOEM3Mi44MzMyIDMzLjMwOTcgNzUuMDgyNiAzMS4wNTkxIDc2Ljg5MjIgMjkuNDAxOEM3Ny41MDI2IDI4Ljg0MjggNzkuNDQyNSAyNi4xNjAxIDgwLjQ3NjQgMjYuMTYwMUM4MC45MDE0IDI2LjE2MDEgODEuNzI0OSAyOC4zMDM4IDgxLjkxMjcgMjguNTg4M0M4NC4zOTcyIDMyLjM1MjMgODguMDQ0NiAzMC45ODk0IDkwLjg3MzMgMjguMzUwNUM5MS4zOTM0IDI3Ljg2NTMgOTQuMTc4MSAyMy45ODM5IDk1LjMwOTEgMjQuNjgzMkM5Ni4yMjAzIDI1LjI0NjYgOTYuNjIxNyAyNi41NzY1IDk3LjA4ODYgMjcuNDYxOEM5Ny44NDg0IDI4LjkwMjkgOTguODEwNyAyOS45Mjk0IDEwMC40MTkgMzAuNDY1N0MxMDMuOTEyIDMxLjYzMSAxMDcuNjggMjguMzYzIDExMS4yMjIgMjguMzYzQzExMi4yNTUgMjguMzYzIDExMi43ODMgMjguOTMxNiAxMTMuMzMyIDI5LjcxNDhDMTE0LjA4MSAzMC43ODIzIDExNC44NTMgMzEuNTI3NiAxMTYuMjA1IDMxLjgxNzVDMTIwLjM5MyAzMi43MTU1IDEyMy44MjIgMjguNzM5OSAxMjcuODcyIDI5LjA4ODlDMTI5LjA1MyAyOS4xOTA3IDEyOS45MzUgMzAuMzgxNiAxMzAuODIxIDMxLjAxNjRDMTMyLjYwOSAzMi4yOTY5IDEzNC43NTkgMzMuMTgzNiAxMzYuOTQ4IDMzLjQ5NDdDMTQwLjQ1NyAzMy45OTM0IDE0My45NzUgMzMuMzMyNiAxNDcuMzk1IDMyLjU5MzVDMTUzLjMgMzEuMzE3NCAxNTkuMTQ3IDI5Ljc5NTggMTY1LjA2MiAyOC41NjMzIiBzdHJva2U9IiNERkUzRUQiIHN0cm9rZS13aWR0aD0iMS41IiBzdHJva2UtbGluZWNhcD0icm91bmQiIHN0cm9rZS1saW5lam9pbj0icm91bmQiLz4KPHBhdGggZD0iTTE5Ni41MTUgMTUuMDc3OEwxODQuNDkyIDAuNTUxNzk1QzE4NC4yNTcgMC4yNjc4MSAxODMuODM4IDAuMjI4MjYgMTgzLjU1NCAwLjQ2MzMwN0wxODAuNjQ5IDIuODY3ODhDMTgwLjM2NSAzLjEwMjkzIDE4MC4zMjUgMy41MjI0IDE4MC41NiAzLjgwNjM4TDE5Mi41ODMgMTguMzMyNEMxOTIuNyAxOC40NzQxIDE5Mi44NjQgMTguNTU1MSAxOTMuMDM0IDE4LjU3MTJDMTkzLjIwNCAxOC41ODcyIDE5My4zOCAxOC41MzgyIDE5My41MjIgMTguNDIwOUwxOTYuNDI3IDE2LjAxNjRDMTk2LjcxMSAxNS43ODEzIDE5Ni43NSAxNS4zNjE4IDE5Ni41MTUgMTUuMDc3OFoiIGZpbGw9IiNERkUzRUQiLz4KPHBhdGggZD0iTTE4MS40MzYgNi45NTc2OUwxNzAuODU1IDkuODI2NDJDMTcwLjYyMiA5Ljg4OTUgMTcwLjQ0MSAxMC4wNzMzIDE3MC4zODMgMTAuMzA3NkwxNjYuMTU1IDI3LjEwMjFMMTczLjk3NSAyMC42Mjk2QzE3My4yNDUgMTkuMjYxNyAxNzMuNTUgMTcuNTE5NCAxNzQuNzkgMTYuNDkyNkMxNzYuMjA2IDE1LjMyMDMgMTc4LjMxMiAxNS41MTk2IDE3OS40ODMgMTYuOTM1MUMxODAuNjU1IDE4LjM1MTMgMTgwLjQ1NiAyMC40NTY2IDE3OS4wNDEgMjEuNjI4MkMxNzguMzMzIDIyLjIxNDQgMTc3LjQ1MiAyMi40NTgyIDE3Ni42MDMgMjIuMzc4MUMxNzUuOTY0IDIyLjMxNzkgMTc1LjM0MyAyMi4wNzQ1IDE3NC44MjUgMjEuNjU3M0wxNjcuMDA1IDI4LjEyOTFMMTg0LjI5NCAyNy4xMTQyQzE4NC41MzQgMjcuMTAwMSAxODQuNzQ5IDI2Ljk1NzYgMTg0Ljg1NCAyNi43NDA2TDE4OS42NSAxNi44ODE5TDE4MS40MzYgNi45NTc2OVoiIGZpbGw9IiNERkUzRUQiLz4KPC9zdmc+Cg==); } .form-spinner-button.form-spinner-up:before { background-image: url(data:image/svg+xml;base64,PHN2ZyB3aWR0aD0iMTQiIGhlaWdodD0iMTQiIHZpZXdCb3g9IjAgMCAxNCAxNCIgZmlsbD0ibm9uZSIgeG1sbnM9Imh0dHA6Ly93d3cudzMub3JnLzIwMDAvc3ZnIj4KPHBhdGggZmlsbC1ydWxlPSJldmVub2RkIiBjbGlwLXJ1bGU9ImV2ZW5vZGQiIGQ9Ik03LjUgMTIuNUw3LjUgNy41TDEyLjUgNy41QzEyLjc3NiA3LjUgMTMgNy4yNzYgMTMgN0MxMyA2LjcyNCAxMi43NzYgNi41IDEyLjUgNi41TDcuNSA2LjVMNy41IDEuNUM3LjUgMS4yMjQgNy4yNzYgMSA3IDFDNi43MjQgMSA2LjUgMS4yMjQgNi41IDEuNUw2LjUgNi41TDEuNSA2LjVDMS4yMjQgNi41IDAuOTk5OTk5IDYuNzI0IDAuOTk5OTk5IDdDMC45OTk5OTkgNy4yNzYgMS4yMjQgNy41IDEuNSA3LjVMNi41IDcuNUw2LjUgMTIuNUM2LjUgMTIuNzc2IDYuNzI0IDEzIDcgMTNDNy4yNzYgMTMgNy41IDEyLjc3NiA3LjUgMTIuNVoiIGZpbGw9IiM1NjY1N0UiIHN0cm9rZT0iIzU2NjU3RSIgc3Ryb2tlLXdpZHRoPSIwLjUiLz4KPC9zdmc+Cg==); } .form-spinner-button.form-spinner-down:before { background-image: url(data:image/svg+xml;base64,PHN2ZyB3aWR0aD0iMTQiIGhlaWdodD0iMyIgdmlld0JveD0iMCAwIDE0IDMiIGZpbGw9Im5vbmUiIHhtbG5zPSJodHRwOi8vd3d3LnczLm9yZy8yMDAwL3N2ZyI+CjxwYXRoIGQ9Ik0xMi41IDJMNy41IDJMMS41IDJDMS4yMjQgMiAxIDEuNzc2IDEgMS41QzEgMS4yMjQgMS4yMjQgMC45OTk5OTkgMS41IDAuOTk5OTk5TDYuNSAxTDEyLjUgMUMxMi43NzYgMSAxMyAxLjIyNCAxMyAxLjVDMTMgMS43NzYgMTIuNzc2IDIgMTIuNSAyWiIgZmlsbD0iIzU2NjU3RSIgc3Ryb2tlPSIjNTY2NTdFIiBzdHJva2Utd2lkdGg9IjAuNSIvPgo8L3N2Zz4K); } .form-collapse-table:after{ background-image: url(data:image/svg+xml;base64,PHN2ZyB3aWR0aD0iMTEiIGhlaWdodD0iMTEiIHZpZXdCb3g9IjAgMCAxMSAxMSIgZmlsbD0ibm9uZSIgeG1sbnM9Imh0dHA6Ly93d3cudzMub3JnLzIwMDAvc3ZnIj4KPGNpcmNsZSBjeD0iNS41IiBjeT0iNS41IiByPSI1LjUiIHRyYW5zZm9ybT0icm90YXRlKC05MCA1LjUgNS41KSIgZmlsbD0iI0MzQ0FEOCIgZmlsbC1vcGFjaXR5PSIwLjUiLz4KPHBhdGggZD0iTTMuMTY3NTYgNC40NjExMkMzLjE0NzkzIDQuNTAzMDggMy4xMzk2MSA0LjU1MDA4IDMuMTQzNTIgNC41OTY4M0MzLjE0NzQzIDQuNjQzNTggMy4xNjM0MyA0LjY4ODI0IDMuMTg5NzIgNC43MjU3OUw1LjMxMTE1IDcuNzU2NEM1LjMzMzEgNy43ODc3NyA1LjM2MTU3IDcuODEzMjMgNS4zOTQzIDcuODMwNzZDNS40MjcwMyA3Ljg0ODI5IDUuNDYzMTIgNy44NTc0MiA1LjQ5OTcyIDcuODU3NDJDNS41MzYzMSA3Ljg1NzQyIDUuNTcyNCA3Ljg0ODI5IDUuNjA1MTMgNy44MzA3NkM1LjYzNzg2IDcuODEzMjMgNS42NjYzMyA3Ljc4Nzc3IDUuNjg4MjkgNy43NTY0TDcuODA5NzIgNC43MjU3OUM3Ljg0MDMyIDQuNjgyMDcgNy44NTY4NiA0LjYyODkgNy44NTY4NiA0LjU3NDI2QzcuODU2NzIgNC41MzQ5OSA3Ljg0ODE4IDQuNDk2MjkgNy44MzE4OCA0LjQ2MTEyQzcuODEyMjggNC40MTkyMiA3Ljc4MjE5IDQuMzgzOTkgNy43NDQ5OCA0LjM1OTM3QzcuNzA3NzYgNC4zMzQ3NSA3LjY2NDg5IDQuMzIxNzEgNy42MjExNSA0LjMyMTcxTDMuMzc4MjkgNC4zMjE3MUMzLjMzNDU1IDQuMzIxNzEgMy4yOTE2NyA0LjMzNDc1IDMuMjU0NDYgNC4zNTkzN0MzLjIxNzI0IDQuMzgzOTkgMy4xODcxNSA0LjQxOTIyIDMuMTY3NTYgNC40NjExMlY0LjQ2MTEyWiIgZmlsbD0iI0U1RTdGMSIvPgo8L3N2Zz4K); } li[data-type=control_fileupload] .qq-upload-button:before { background-image: url(data:image/svg+xml;base64,PHN2ZyB3aWR0aD0iMzkiIGhlaWdodD0iMjciIHZpZXdCb3g9IjAgMCAzOSAyNyIgZmlsbD0ibm9uZSIgeG1sbnM9Imh0dHA6Ly93d3cudzMub3JnLzIwMDAvc3ZnIj4KPHBhdGggZD0iTTMyLjM3NSAxMS4zMTI1QzMxLjUgNC44MTI1IDI2IDAgMTkuMzc1IDBDMTMuNjg3NSAwIDguNzUgMy41NjI1IDYuOTM3NSA4LjkzNzVDMi44NzUgOS44MTI1IDAgMTMuMzEyNSAwIDE3LjVDMCAyMi4wNjI1IDMuNTYyNSAyNS44NzUgOC4xMjUgMjYuMjVIMzEuODc1SDMxLjkzNzVDMzUuNzUgMjUuODc1IDM4Ljc1IDIyLjYyNSAzOC43NSAxOC43NUMzOC43NSAxNS4wNjI1IDM2IDExLjg3NSAzMi4zNzUgMTEuMzEyNVpNMjYuMDYyNSAxNC44MTI1QzI1LjkzNzUgMTQuOTM3NSAyNS44MTI1IDE1IDI1LjYyNSAxNUMyNS40Mzc1IDE1IDI1LjMxMjUgMTQuOTM3NSAyNS4xODc1IDE0LjgxMjVMMjAgOS42MjVWMjEuODc1QzIwIDIyLjI1IDE5Ljc1IDIyLjUgMTkuMzc1IDIyLjVDMTkgMjIuNSAxOC43NSAyMi4yNSAxOC43NSAyMS44NzVWOS42MjVMMTMuNTYyNSAxNC44MTI1QzEzLjMxMjUgMTUuMDYyNSAxMi45Mzc1IDE1LjA2MjUgMTIuNjg3NSAxNC44MTI1QzEyLjQzNzUgMTQuNTYyNSAxMi40Mzc1IDE0LjE4NzUgMTIuNjg3NSAxMy45Mzc1TDE4LjkzNzUgNy42ODc1QzE5IDcuNjI1IDE5LjA2MjUgNy41NjI1IDE5LjEyNSA3LjU2MjVDMTkuMjUgNy41IDE5LjQzNzUgNy41IDE5LjYyNSA3LjU2MjVDMTkuNjg3NSA3LjYyNSAxOS43NSA3LjYyNSAxOS44MTI1IDcuNjg3NUwyNi4wNjI1IDEzLjkzNzVDMjYuMzEyNSAxNC4xODc1IDI2LjMxMjUgMTQuNTYyNSAyNi4wNjI1IDE0LjgxMjVaIiBmaWxsPSIjQjNCQ0NDIi8+Cjwvc3ZnPgo=); } .appointmentDayPickerButton { background-image: url(data:image/svg+xml;base64,PHN2ZyB3aWR0aD0iOCIgaGVpZ2h0PSIxNCIgdmlld0JveD0iMCAwIDggMTQiIGZpbGw9Im5vbmUiIHhtbG5zPSJodHRwOi8vd3d3LnczLm9yZy8yMDAwL3N2ZyI+CjxwYXRoIGQ9Ik0xIDEzTDcgN0wxIDAuOTk5OTk5IiBzdHJva2U9IiM4Nzk1QUMiIHN0cm9rZS13aWR0aD0iMiIgc3Ryb2tlLWxpbmVjYXA9InJvdW5kIiBzdHJva2UtbGluZWpvaW49InJvdW5kIi8+Cjwvc3ZnPgo=); } /* NEW THEME STYLE */ /*PREFERENCES STYLE*/ /*PREFERENCES STYLE*/ .form-all { font-family: Inter, sans-serif; } .form-all .qq-upload-button, .form-all .form-submit-button, .form-all .form-submit-reset, .form-all .form-submit-print { font-family: Inter, sans-serif; } .form-all .form-pagebreak-back-container, .form-all .form-pagebreak-next-container { font-family: Inter, sans-serif; } .form-header-group { font-family: Inter, sans-serif; } .form-label { font-family: Inter, sans-serif; } .form-label.form-label-auto { display: block; float: none; text-align: left; width: 100%; } .form-line { margin-top: 6px 10px 7px 10pxpx; margin-bottom: 6px 10px 7px 10pxpx; } .form-all { max-width: 752px; width: 100%; } .form-label.form-label-left, .form-label.form-label-right, .form-label.form-label-left.form-label-auto, .form-label.form-label-right.form-label-auto { width: 230px; } .form-all { font-size: 16px } .form-all .qq-upload-button, .form-all .qq-upload-button, .form-all .form-submit-button, .form-all .form-submit-reset, .form-all .form-submit-print { font-size: 16px } .form-all .form-pagebreak-back-container, .form-all .form-pagebreak-next-container { font-size: 16px } .supernova { background-color: #F3F3FE; } .supernova body { background: transparent; } .supernova .form-all, .form-all { background-color: #FFFFFF; } .form-all { color: #2C3345; } .form-header-group .form-header { color: #2C3345; } .form-header-group .form-subHeader { color: #2C3345; } .form-label-top, .form-label-left, .form-label-right, .form-html, .form-checkbox-item label, .form-radio-item label { color: #2C3345; } .form-sub-label { color: #464d5f; } .form-textbox, .form-textarea, .form-dropdown, .form-radio-other-input, .form-checkbox-other-input, .form-captcha input, .form-spinner input { background-color: #FFFFFF; } .form-line-error { overflow: hidden; transition: none; background-color: #FFD6D6; } .form-line-error .form-error-message { background-color: #FF3200; clear: both; float: none; } .form-line-error .form-error-arrow { border-bottom-color: #FF3200; } .form-line-error input:not(#coupon-input), .form-line-error textarea, .form-line-error .form-validation-error { border: 1px solid #FF3200; .box-shadow(0 0 3px #FF3200); } .supernova { background-image: none; } #stage { background-image: none; } .form-all { background-image: none; } .ie-8 .form-all:before { display: none; } .ie-8 { margin-top: auto; margin-top: initial; } /*PREFERENCES STYLE*//*__INSPECT_SEPERATOR__*/ /* Injected CSS Code */ JotForm.ownerView=true;
Comments are closed