
Optimize Your POS Reports for Wholesale Business
By Jim Lewis, CEO Enhanced Retail Solutions LLC
One of the key reasons wholesalers come to us is because they want to get more actionable information from their POS reporting. Their team spends hours and days showing data in so many ways that it doesn’t always translate into anything useful. Sometimes taking a step back, and simplifying reporting is the most effective way of making progress.
Item Status
Before we get into reports, there is an important attribute required in managing items. Besides the product attributes like description, color and size, Item Status is critical. Retailers use it religiously, but wholesalers often overlook it or misuse it. It is essential in knowing what the plan is for a given item- is it active and replenishable, discontinued and on the way out or somewhere in the middle. Knowing how much of your business is in each of these “buckets” is very helpful. For example, if most of your items are in sell down or discontinued how are you going to grow? Once every item is assigned a status you are ready to build some actionable reports.
Reports to Meet Goals
The key is to target reports to specific goals. Goals vary by company and their business model, but most have at least these 3:
- Get a quick sense of how the business is doing. Is it growing, staying the same or declining? Which categories are driving the business and which items within those categories are driving the business compared to last year?
- Improve inventory turnover. Since inventory is the main capital investment, managing it efficiently is a top priority. Good item level reporting should help answer the questions- buy more, markdown, or continue to watch.
- Communicate more effectively with their retail partners. Buyers expect their suppliers to know their business better than they do. Making recommendations based on fact-based data and providing everything the buyer needs to execute it is key.
All of these can be accomplished with 3 concise, targeted reports. Reports shouldn’t just be a page with a bunch of numbers. It should tell a story that is easy to understand and digest quickly. We recommend the repertoire includes:
- Filtered Performance– This is an item level report that includes multiple time frames- last week, last 4 weeks, last 8 weeks and year to date. Unit and dollar sales, inventory, sell through, average selling prices, etc. We also include inventory health- based on weeks of supply- healthy, low stock, critical low stock, surplus and extreme surplus. Then we add unit and dollar performance rankings including top performer, above average, average, below average and bottom performer. Based on a combination of those 3 rankings a recommended action is made. For example, top performer with critical low stock provides an action of Buy. A poor performer with extreme surplus would yield a markdown recommendation. Average performer with healthy or surplus might recommend a sell down or watch. Add filters to all the columns so you can quickly see just the top performers, or problems, or anything active that you should buy. If you really want to make it special add an image for each item. You can find an example of this smart POS report here.
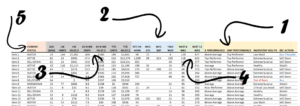
Smart POS reporting- Show recommended actions based on performance rankings.
- TY vs. LY: Needs 3 drill levels- From top line to department/category, program level and program-color. At a minimum it should include unit and dollar sales and inventory. To get a better comparison at store count, SKU count and average selling price. Then you have a complete picture of how the business is doing compared to last year, and why. Do you have more stores, or less SKU’s? Has the price changed, etc.? Highlight large % differences using different colors for quick call outs.
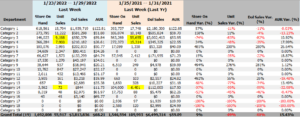
TY vs. LY by department
- Multi-Week Tracking– Week over week comparisons are important because they show if velocity is increasing or decreasing. Not every week is supposed to be up over the prior week unless there is no seasonality in your product. Use the same drill levels as the TY vs. LY report.

Multi Week POS Tracking
Include Both Retail and Wholesale Inventory On the Same Report
We recommend showing both retail and wholesale inventory (including WIP) on the reports. That can save time by not having to go look at a separate wholesale inventory report. Wouldn’t it be nice to use the same report to see if you have the inventory to ship the retailer if you’re going to recommend they buy more?
These reports provide a great starting point and can be customized for your business. The key is to get everyone in your organization to standardize how they think about performance. What is considered good or bad- and build that logic into your reporting.
For more information or a sample of these reports for your company please contact us.
JotForm.newDefaultTheme = false;
JotForm.extendsNewTheme = true;
JotForm.singleProduct = false;
JotForm.newPaymentUIForNewCreatedForms = false;
JotForm.newPaymentUI = true;
JotForm.highlightInputs = false;
JotForm.init(function(){
/*INIT-START*/
if (window.JotForm && JotForm.accessible) $('input_1').setAttribute('tabindex',0);
if (window.JotForm && JotForm.accessible) $('input_3').setAttribute('tabindex',0);
JotForm.setPhoneMaskingValidator( 'input_12_full', '(###) ###-####' );
if (window.JotForm && JotForm.accessible) $('input_4').setAttribute('tabindex',0);
JotForm.setCustomHint( 'input_4', 'Type here...' );
JotForm.alterTexts({"confirmClearForm":"Are you sure you want to clear the form","incompleteFields":"Please complete required (*) fields.","lessThan":"Your score should be less than"});
/*INIT-END*/
});
JotForm.prepareCalculationsOnTheFly([null,{"description":"","name":"name1","qid":"1","subLabel":"","text":"Name","type":"control_textbox"},null,{"description":"","name":"email","qid":"3","subLabel":"","text":"E-mail","type":"control_textbox"},{"description":"","name":"howMay","qid":"4","subLabel":"","text":"How may we help you?","type":"control_textarea"},null,null,{"name":"submit7","qid":"7","text":"Submit","type":"control_button"},null,null,null,null,{"description":"","name":"phoneNumber","qid":"12","text":"Phone Number","type":"control_phone"}]);
setTimeout(function() {
JotForm.paymentExtrasOnTheFly([null,{"description":"","name":"name1","qid":"1","subLabel":"","text":"Name","type":"control_textbox"},null,{"description":"","name":"email","qid":"3","subLabel":"","text":"E-mail","type":"control_textbox"},{"description":"","name":"howMay","qid":"4","subLabel":"","text":"How may we help you?","type":"control_textarea"},null,null,{"name":"submit7","qid":"7","text":"Submit","type":"control_button"},null,null,null,null,{"description":"","name":"phoneNumber","qid":"12","text":"Phone Number","type":"control_phone"}]);}, 20);
@media print{.form-section{display:inline!important}.form-pagebreak{display:none!important}.form-section-closed{height:auto!important}.page-section{position:initial!important}}
/* Injected CSS Code */
/*PREFERENCES STYLE*/
/* NEW THEME STYLE */
/* colors */
.form-textbox, .form-textarea {
color: undefined;
}
.rating-item input:hover+label {
color: #2e69ff;
}
li[data-type=control_fileupload] .qq-upload-button,
.until-text,
.form-submit-reset {
color: #2c3345;
}
.stageEmpty.isSmall{
color: #CAD0CF;
}
.rating-item label {
color: #b8bdc9;
}
.currentDate,
.pickerItem select,
.appointmentCalendar .calendarDay,
.calendar.popup th,
.calendar.popup table tbody td,
.calendar-new-header>*,
.form-collapse-table {
color: #2C3345;
}
.appointmentCalendar .dayOfWeek {
color: #2e69ff;
}
.appointmentSlotsContainer > * {
color: #2e69ff;
}
li[data-type=control_fileupload] .jfUpload-heading,
::placeholder,
.form-dropdown.is-active,
.form-dropdown:first-child,
.form-spinner-input {
color: #57647e;
}
.appointmentCalendar .calendarWeek .calendarDay.isUnavailable,
.calendar tr.days td.otherDay,
.calendar tr.days td:hover:not(.unselectable) {
color: #CAD0CF;
}
span.form-sub-label, label.form-sub-label, div.form-header-group .form-subHeader,
.rating-item-title.for-to > label:first-child,
.rating-item-title.for-from > label:first-child,
.rating-item-title .editor-container * {
color: #57647E;
}
.form-pagebreak-back{
color: #2c3345;
}
.rating-item input:checked+label,
.rating-item input:focus+label {
color: #FFFFFF;
}
.clear-pad-btn {
color: #57647e;
}
.form-textbox::placeholder,
.form-dropdown:not(.time-dropdown):not(:required),
.form-dropdown:not(:required),
.form-dropdown:required:invalid {
color: #57647e;
}
/* border-colors */
.form-dropdown,
.form-textarea,
.form-textbox,
li[data-type=control_fileupload] .qq-upload-button,
.rating-item label,
.rating-item input:focus+label,
.rating-item input:checked+label,
.jf-form-buttons,
.form-checkbox+label:before, .form-checkbox+span:before, .form-radio+label:before, .form-radio+span:before,
.signature-pad-passive,
.signature-wrapper,
.appointmentCalendarContainer,
.appointmentField .timezonePickerName,
.appointmentDayPickerButton,
.appointmentCalendarContainer .monthYearPicker .pickerItem+.pickerItem,
.appointmentCalendarContainer .monthYearPicker,
.appointmentCalendar .calendarDay.isActive .calendarDayEach, .appointmentCalendar .calendarDay.isToday .calendarDayEach, .appointmentCalendar .calendarDay:not(.empty):hover .calendarDayEach,
.calendar.popup:before,
.calendar-new-month,
.form-matrix-column-headers, .form-matrix-table td, .form-matrix-table td:last-child,
.form-matrix-table th, .form-matrix-table th:last-child, .form-matrix-table tr:last-child td, .form-matrix-table tr:last-child th, .form-matrix-table tr:not([role=group])+tr[role=group] th,
.form-matrix-headers.form-matrix-column-headers,
.isSelected .form-matrix-column-headers:nth-last-of-type(2),
li[data-type=control_inline] input[type=email], li[data-type=control_inline] input[type=number],
li[data-type=control_inline] input[type=tel], li[data-type=control_inline] input[type=text],
.stageEmpty.isSmall {
border-color: #b8bdc9;
}
.rating-item input:hover+label {
border-color: #2e69ff;
}
.appointmentSlot,
.form-checkbox:checked+label:before, .form-checkbox:checked+span:before, .form-checkbox:checked+span label:before,
.form-radio:checked+label:before, .form-radio:checked+span:before,
.form-dropdown:focus, .form-textarea:focus, .form-textbox:focus, .signature-wrapper:focus,
.form-line[data-payment="true"] .form-product-item .p_checkbox .checked,
.form-dropdown:hover, .form-textarea:hover, .form-textbox:hover, .signature-wrapper:hover {
border-color: #2e69ff;
}
.calendar tr.days td:hover:not(.unselectable):after {
border-color: #e5eaf4;
}
.form-header-group,
.form-buttons-wrapper, .form-pagebreak, .form-submit-clear-wrapper,
.form-pagebreak-next,
.form-pagebreak-back,
.form-checkbox:hover+label:before, .form-checkbox:hover+span:before, .form-radio:hover+label:before, .form-radio:hover+span:before,
.divider {
border-color: #F3F3FE;
}
.form-pagebreak-back:focus, .form-pagebreak-next:focus, .form-submit-button:focus {
border-color: rgba(46, 105, 255, 1);
}
/* background-colors */
.form-line-active {
background-color: #F1F5FF;
}
.form-line-error {
background-color: #FFD6D6;
}
.form-matrix-column-headers, .form-matrix-row-headers,
.form-spinner-button-container>*,
.form-collapse-table,
.form-collapse-table:hover,
.appointmentDayPickerButton {
background-color: #e5eaf4;
}
.calendar.popup, .calendar.popup table,
.calendar.popup table tbody td:after{
background-color: #FFFFFF;
}
.appointmentCalendar .calendarDay.isActive .calendarDayEach,
.appointmentFieldRow.forSelectedDate,
.calendar.popup tr.days td.selected:after,
.calendar.popup:after,
.submit-button,
.form-checkbox:checked+label:before, .form-checkbox:checked+span:before, .form-checkbox:checked+span label:before,
.form-radio+label:after, .form-radio+span:after,
.rating-item input:checked+label,
.appointmentCalendar .calendarDay:after,
.form-line[data-payment="true"] .form-product-item .p_checkbox .checked,
.rating-item input:focus+label {
background-color: #2e69ff;
}
.appointmentSlot.active {
background-color: #2e69ff !important;
}
.clear-pad-btn,
.appointmentCalendar .dayOfWeek,
.calendar.popup th {
background-color: #eef3ff !important;
}
.appointmentField .timezonePicker:hover+.timezonePickerName,
.form-spinner-button-container>*:hover {
background-color: #eef3ff;
}
.form-matrix-values,
.form-matrix-values,
.signature-wrapper,
.signature-pad-passive,
.rating-item label,
.form-checkbox+label:before, .form-checkbox+span:before,
.form-radio+label:before, .form-radio+span:before {
background-color: #FFFFFF;
}
li[data-type=control_fileupload] .qq-upload-button {
background-color: #fbfcff;
}
.JotFormBuilder .appContainer #app li.form-line[data-type=control_matrix].isSelected
.questionLine-editButton.forRemove:after,
.JotFormBuilder .appContainer #app li.form-line[data-type=control_matrix].isSelected .questionLine-editButton.forRemove:before {
background-color: #FFFFFF;
}
.appointmentCalendarContainer, .appointmentSlot,
.rating-item-title.for-to > label:first-child,
.rating-item-title.for-from > label:first-child,
.rating-item-title .editor-container *,
.calendar-opened {
background-color: transparent;
}
.page-section li.form-line-active[data-type="control_button"] {
background-color: #F1F5FF;
}
.appointmentCalendar .calendarDay.isSelected:after {
color: #FFFFFF;
}
/* shadow */
.form-dropdown:hover, .form-textarea:hover, .form-textbox:hover, .signature-wrapper:hover,
.calendar.popup:before,
.jSignature:hover,
li[data-type=control_fileupload] .qq-upload-button-hover,
.form-line[data-payment="true"] .form-product-item .p_checkbox .checked,
.form-line[data-payment="true"] .form-product-item .p_checkbox:hover .select_border,
.form-checkbox:hover+label:before, .form-checkbox:hover+span:before, .form-radio:hover+label:before, .form-radio:hover+span:before,
.calendar.popup:before {
border-color: rgba(46, 105, 255, 0.5);
box-shadow: 0 0 0 2px rgba(46, 105, 255, 0.25);
}
.form-dropdown:focus, .form-textarea:focus, .form-textbox:focus, .signature-wrapper:focus,
li[data-type=control_fileupload] .qq-upload-button-focus,
.form-checkbox:focus+label:before, .form-checkbox:focus+span:before, .form-radio:focus+label:before, .form-radio:focus+span:before,
.calendar.popup:before {
border-color: rgba(46, 105, 255, 1);
box-shadow: 0 0 0 3px rgba(46, 105, 255, 0.25);
}
.calendar.popup table tbody td{
box-shadow: none;
}
/* button colors */
.submit-button {
background-color: #18BD5B;
border-color: #18BD5B;
}
.submit-button:hover {
background-color: #16AA52;
border-color: #16AA52;
}
.form-pagebreak-next {
background-color: #2e69ff;
}
.form-pagebreak-back {
background-color: #e5e7f2;
}
.form-pagebreak-back:hover {
background-color: #CED0DA;
border-color: #CED0DA;
}
.form-pagebreak-next:hover {
background-color: #2554CC;
border-color: #2554CC;
}
.form-sacl-button, .form-submit-print {
background-color: transparent;
color: #2c3345;
border-color: #b8bdc9;
}
.form-sacl-button:hover, .form-submit-print:hover,
.appointmentSlot:not(.disabled):not(.active):hover,
.appointmentDayPickerButton:hover,
.rating-item input:hover+label {
background-color: #96B4FF;
}
/* payment styles */
.form-line[data-payment=true] .form-textbox,
.form-line[data-payment=true] .select-area,
.form-line[data-payment=true] #coupon-input,
.form-line[data-payment=true] #coupon-container input,
.form-line[data-payment=true] input#productSearch-input,
.form-line[data-payment=true] .form-product-category-item:after,
.form-line[data-payment=true] .filter-container .dropdown-container .select-content,
.form-line[data-payment=true] .form-textbox.form-product-custom_quantity,
.form-line[data-payment="true"] .form-product-item .p_checkbox .select_border,
.form-line[data-payment="true"] .form-product-item .form-product-container .form-sub-label-container span.select_cont,
.form-line[data-payment=true] select.form-dropdown,
.form-line[data-payment=true] #payment-category-dropdown .select-area,
.form-line[data-payment=true] #payment-sorting-products-dropdown .select-area,
.form-line[data-payment=true] .dropdown-container .select-content {
border-color: #b8bdc9;
border-color: undefined;
}
.form-line[data-payment="true"] hr,
.form-line[data-payment=true] .p_item_separator,
.form-line[data-payment="true"] .payment_footer.new_ui,
.form-line.card-3col .form-product-item.new_ui,
.form-line.card-2col .form-product-item.new_ui {
border-color: #b8bdc9;
border-color: undefined;
}
.form-line[data-payment=true] .form-product-category-item {
border-color: #b8bdc9;
border-color: undefined;
}
.form-line[data-payment=true] #coupon-input,
.form-line[data-payment=true] .form-textbox.form-product-custom_quantity,
.form-line[data-payment=true] input#productSearch-input,
.form-line[data-payment=true] .select-area,
.form-line[data-payment=true] .custom_quantity,
.form-line[data-payment=true] .filter-container .select-content,
.form-line[data-payment=true] .p_checkbox .select_border,
.form-line[data-payment=true] #payment-category-dropdown .select-area,
.form-line[data-payment=true] #payment-sorting-products-dropdown .select-area,
.form-line[data-payment=true] .dropdown-container .select-content {
background-color: #FFFFFF;
}
.form-line[data-payment=true] .form-product-category-item.title_collapsed.has_selected_product .selected-items-icon {
background-color: undefined;
border-color: undefined;
}
.form-line[data-payment=true].form-line.card-3col .form-product-item,
.form-line[data-payment=true].form-line.card-2col .form-product-item {
background-color: undefined;
}
.form-line[data-payment=true] .payment-form-table input.form-textbox,
.form-line[data-payment=true] .payment-form-table input.form-dropdown,
.form-line[data-payment=true] .payment-form-table .form-sub-label-container > div,
.form-line[data-payment=true] .payment-form-table span.form-sub-label-container iframe,
.form-line[data-type=control_square] .payment-form-table span.form-sub-label-container iframe {
border-color: #b8bdc9;
}
/* icons */
.appointmentField .timezonePickerName:before {
background-image: url(data:image/svg+xml;base64,PHN2ZyB3aWR0aD0iMTYiIGhlaWdodD0iMTYiIHZpZXdCb3g9IjAgMCAxNiAxNiIgZmlsbD0ibm9uZSIgeG1sbnM9Imh0dHA6Ly93d3cudzMub3JnLzIwMDAvc3ZnIj4KPHBhdGggZmlsbC1ydWxlPSJldmVub2RkIiBjbGlwLXJ1bGU9ImV2ZW5vZGQiIGQ9Ik0wIDcuOTYwMkMwIDMuNTY2MTcgMy41NTgyMSAwIDcuOTUyMjQgMEMxMi4zNTQyIDAgMTUuOTIwNCAzLjU2NjE3IDE1LjkyMDQgNy45NjAyQzE1LjkyMDQgMTIuMzU0MiAxMi4zNTQyIDE1LjkyMDQgNy45NTIyNCAxNS45MjA0QzMuNTU4MjEgMTUuOTIwNCAwIDEyLjM1NDIgMCA3Ljk2MDJaTTEuNTkzNzUgNy45NjAyQzEuNTkzNzUgMTEuNDc4NiA0LjQ0MzUgMTQuMzI4NCA3Ljk2MTkxIDE0LjMyODRDMTEuNDgwMyAxNC4zMjg0IDE0LjMzMDEgMTEuNDc4NiAxNC4zMzAxIDcuOTYwMkMxNC4zMzAxIDQuNDQxNzkgMTEuNDgwMyAxLjU5MjA0IDcuOTYxOTEgMS41OTIwNEM0LjQ0MzUgMS41OTIwNCAxLjU5Mzc1IDQuNDQxNzkgMS41OTM3NSA3Ljk2MDJaIiBmaWxsPSIjMTExMTExIi8+CjxwYXRoIGQ9Ik04LjM1ODA5IDMuOTgwNDdINy4xNjQwNlY4Ljc1NjU5TDExLjM0MzIgMTEuMjY0MUwxMS45NDAyIDEwLjI4NDlMOC4zNTgwOSA4LjE1OTU3VjMuOTgwNDdaIiBmaWxsPSIjMTExMTExIi8+Cjwvc3ZnPgo=);
}
.appointmentCalendarContainer .monthYearPicker .pickerArrow.prev:after {
background-image: url(data:image/svg+xml;base64,PHN2ZyB3aWR0aD0iMTAiIGhlaWdodD0iNiIgdmlld0JveD0iMCAwIDEwIDYiIGZpbGw9Im5vbmUiIHhtbG5zPSJodHRwOi8vd3d3LnczLm9yZy8yMDAwL3N2ZyI+CjxwYXRoIGQ9Ik04LjU5NzgyIDUuMzMyNzNDOC45MzMxMiA1LjYzNjI3IDkuNDM5MzkgNS42Mjk2OSA5Ljc1NjEzIDUuMzEyNzhDMTAuMDgxMyA0Ljk4NzQ1IDEwLjA4MTMgNC40NTk2MyA5Ljc1NjEzIDQuMTM0M0M5LjYwOTA0IDMuOTk2MzUgOS42MDkwMyAzLjk5NjM1IDkuMDg5NDkgMy41MTExOEM4LjQzNzQyIDIuOTAyMTggOC40Mzc0MyAyLjkwMjE4IDcuNjU1MTEgMi4xNzE1NkM2LjA4OTU2IDAuNzA5NDQ3IDYuMDg5NTYgMC43MDk0NDYgNS41Njc3MyAwLjIyMjEwMUM1LjI0MTA0IC0wLjA3NDUwNjcgNC43NTA4NSAtMC4wNzM1MDMgNC40MzIzNSAwLjIyMTkyOUwwLjI2MjU0IDQuMTE0MjRDLTAuMDgwNTQ1OSA0LjQ1NTQ1IC0wLjA4NzE3MTEgNC45ODM5NyAwLjI0MTQ2OCA1LjMxMjc4QzAuNTU5NTU4IDUuNjMxMDUgMS4wNjk3NSA1LjYzNjY4IDEuMzk3MDMgNS4zMzI2Mkw0Ljk5ODkxIDEuOTcxMzFMOC41OTc4MiA1LjMzMjczWiIgZmlsbD0iI0NGQ0ZDRiIvPgo8L3N2Zz4K);
}
.appointmentCalendarContainer .monthYearPicker .pickerArrow.next:after {
background-image: url(data:image/svg+xml;base64,PHN2ZyB3aWR0aD0iMTAiIGhlaWdodD0iNiIgdmlld0JveD0iMCAwIDEwIDYiIGZpbGw9Im5vbmUiIHhtbG5zPSJodHRwOi8vd3d3LnczLm9yZy8yMDAwL3N2ZyI+CjxwYXRoIGQ9Ik0xLjQwMjE4IDAuMjIzNDk3QzEuMDY2ODcgLTAuMDgwMTAyOCAwLjU2MDYwMiAtMC4wNzM1MDI4IDAuMjQzODY5IDAuMjQzMzk3Qy0wLjA4MTI4OTggMC41Njg2OTcgLTAuMDgxMjg5OCAxLjA5NjYgMC4yNDM4NjkgMS40MjE5QzAuMzkwOTU2IDEuNTU5OCAwLjM5MDk2NiAxLjU1OTggMC45MTA1MSAyLjA0NUMxLjU2MjU3IDIuNjU0IDEuNTYyNTYgMi42NTQgMi4zNDQ4OCAzLjM4NDZDMy45MTA0NCA0Ljg0NjcgMy45MTA0MyA0Ljg0NjcgNC40MzIyNyA1LjMzNDFDNC43NTg5NSA1LjYzMDcgNS4yNDkxNSA1LjYyOTcgNS41Njc2NCA1LjMzNDNMOS43Mzc0NiAxLjQ0MkMxMC4wODA1IDEuMTAwNyAxMC4wODcxIDAuNTcyMTk3IDkuNzU4NTMgMC4yNDMzOTdDOS40NDA0NCAtMC4wNzQ5MDI4IDguOTMwMjQgLTAuMDgwNTAyOCA4LjYwMjk3IDAuMjIzNTk3TDUuMDAxMDggMy41ODQ5TDEuNDAyMTggMC4yMjM0OTdaIiBmaWxsPSIjQ0ZDRkNGIi8+Cjwvc3ZnPgo=);
}
.appointmentField .timezonePickerName:after {
background-image: url(data:image/svg+xml;base64,PHN2ZyB3aWR0aD0iMTAiIGhlaWdodD0iNiIgdmlld0JveD0iMCAwIDEwIDYiIGZpbGw9Im5vbmUiIHhtbG5zPSJodHRwOi8vd3d3LnczLm9yZy8yMDAwL3N2ZyI+CjxwYXRoIGQ9Ik0wLjA1Mjk5IDAuMjM2NTcyQzAuMDExMzU0NiAwLjMwNzc4NSAtMC4wMDYzMDI4MiAwLjM4NzUzNCAwLjAwMTk5OTIzIDAuNDY2ODdDMC4wMTAzMDEzIDAuNTQ2MjA2IDAuMDQ0MjM0MyAwLjYyMTk4OSAwLjA5OTk5MDEgMC42ODU3MTVMNC41OTk5OSA1LjgyODU3QzQuNjQ2NTcgNS44ODE4IDQuNzA2OTYgNS45MjUgNC43NzYzOSA1Ljk1NDc1QzQuODQ1ODIgNS45ODQ1MSA0LjkyMjM3IDYgNC45OTk5OSA2QzUuMDc3NjIgNiA1LjE1NDE3IDUuOTg0NTEgNS4yMjM2IDUuOTU0NzVDNS4yOTMwMyA1LjkyNSA1LjM1MzQyIDUuODgxOCA1LjQgNS44Mjg1N0w5LjkgMC42ODU3MTRDOS45NjQ5MSAwLjYxMTUzIDEwIDAuNTIxMzAxIDEwIDAuNDI4NTcxQzkuOTk5NzEgMC4zNjE5MzggOS45ODE1NyAwLjI5NjI1MiA5Ljk0NyAwLjIzNjU3MUM5LjkwNTQzIDAuMTY1NDc0IDkuODQxNjEgMC4xMDU2OTEgOS43NjI2NyAwLjA2MzkxMTVDOS42ODM3MyAwLjAyMjEzMTcgOS41OTI3OCAyLjYwNjg5ZS0wNiA5LjUgLTUuNzYzMDNlLTA4TDAuNDk5OTkgMy4zNTc3M2UtMDdDMC40MDcyMTIgMy4wMDg0ZS0wNiAwLjMxNjI2NCAwLjAyMjEzMjEgMC4yMzczMjEgMC4wNjM5MTE5QzAuMTU4Mzc5IDAuMTA1NjkyIDAuMDk0NTU0NyAwLjE2NTQ3NCAwLjA1Mjk5IDAuMjM2NTcyVjAuMjM2NTcyWiIgZmlsbD0iIzExMTExMSIvPgo8L3N2Zz4K);
width: 11px;
}
li[data-type=control_datetime] [data-wrapper-react=true].extended>div+.form-sub-label-container .form-textbox:placeholder-shown,
li[data-type=control_datetime] [data-wrapper-react=true]:not(.extended) .form-textbox:not(.time-dropdown):placeholder-shown,
.appointmentCalendarContainer .currentDate {
background-image: url(data:image/svg+xml;base64,PHN2ZyB3aWR0aD0iMTciIGhlaWdodD0iMTYiIHZpZXdCb3g9IjAgMCAxNyAxNiIgZmlsbD0ibm9uZSIgeG1sbnM9Imh0dHA6Ly93d3cudzMub3JnLzIwMDAvc3ZnIj4KPHBhdGggZD0iTTE1Ljk0ODkgNVYxNS4wMjZDMTUuOTQ4OSAxNS41NjM5IDE1LjUwMjYgMTYgMTQuOTUyMSAxNkgwLjk5NjgwNUMwLjQ0NjI4NSAxNiAwIDE1LjU2MzkgMCAxNS4wMjZWNUgxNS45NDg5Wk00LjE5MjQ1IDExLjQxNjdIMi4zNzQ3NEwyLjI4NTE1IDExLjQyNDdDMi4xMTA3OCAxMS40NTY1IDEuOTY4MDEgMTEuNTc5MiAxLjkwNzUyIDExLjc0MjJMMS44ODQzNyAxMS44MjY4TDEuODc2MzQgMTEuOTE2N1YxMy42NjY3TDEuODg0MzcgMTMuNzU2NUMxLjkxNjAyIDEzLjkzMTUgMi4wMzg0IDE0LjA3NDcgMi4yMDA4MyAxNC4xMzU0TDIuMjg1MTUgMTQuMTU4NkwyLjM3NDc0IDE0LjE2NjdINC4xOTI0NUw0LjI4MjAzIDE0LjE1ODZDNC40NTY0MSAxNC4xMjY5IDQuNTk5MTggMTQuMDA0MSA0LjY1OTY3IDEzLjg0MTFMNC42ODI4MiAxMy43NTY1TDQuNjkwODUgMTMuNjY2N1YxMS45MTY3TDQuNjgyODIgMTEuODI2OEM0LjY1MTE3IDExLjY1MTkgNC41Mjg3OSAxMS41MDg2IDQuMzY2MzUgMTEuNDQ3OUw0LjI4MjAzIDExLjQyNDdMNC4xOTI0NSAxMS40MTY3Wk04Ljg4MzI5IDExLjQxNjdINy4wNjU1OUw2Ljk3NiAxMS40MjQ3QzYuODAxNjIgMTEuNDU2NSA2LjY1ODg1IDExLjU3OTIgNi41OTgzNyAxMS43NDIyTDYuNTc1MjIgMTEuODI2OEw2LjU2NzE5IDExLjkxNjdWMTMuNjY2N0w2LjU3NTIyIDEzLjc1NjVDNi42MDY4NyAxMy45MzE1IDYuNzI5MjUgMTQuMDc0NyA2Ljg5MTY4IDE0LjEzNTRMNi45NzYgMTQuMTU4Nkw3LjA2NTU5IDE0LjE2NjdIOC44ODMyOUw4Ljk3Mjg4IDE0LjE1ODZDOS4xNDcyNiAxNC4xMjY5IDkuMjkwMDMgMTQuMDA0MSA5LjM1MDUxIDEzLjg0MTFMOS4zNzM2NyAxMy43NTY1TDkuMzgxNyAxMy42NjY3VjExLjkxNjdMOS4zNzM2NyAxMS44MjY4QzkuMzQyMDIgMTEuNjUxOSA5LjIxOTY0IDExLjUwODYgOS4wNTcyIDExLjQ0NzlMOC45NzI4OCAxMS40MjQ3TDguODgzMjkgMTEuNDE2N1pNNC4xOTI0NSA2LjgzMzMzSDIuMzc0NzRMMi4yODUxNSA2Ljg0MTM5QzIuMTEwNzggNi44NzMxNCAxLjk2ODAxIDYuOTk1OTEgMS45MDc1MiA3LjE1ODg3TDEuODg0MzcgNy4yNDM0NkwxLjg3NjM0IDcuMzMzMzNWOS4wODMzM0wxLjg4NDM3IDkuMTczMjFDMS45MTYwMiA5LjM0ODE1IDIuMDM4NCA5LjQ5MTM3IDIuMjAwODMgOS41NTIwNUwyLjI4NTE1IDkuNTc1MjhMMi4zNzQ3NCA5LjU4MzMzSDQuMTkyNDVMNC4yODIwMyA5LjU3NTI4QzQuNDU2NDEgOS41NDM1MyA0LjU5OTE4IDkuNDIwNzUgNC42NTk2NyA5LjI1NzhMNC42ODI4MiA5LjE3MzIxTDQuNjkwODUgOS4wODMzM1Y3LjMzMzMzTDQuNjgyODIgNy4yNDM0NkM0LjY1MTE3IDcuMDY4NTIgNC41Mjg3OSA2LjkyNTI5IDQuMzY2MzUgNi44NjQ2MUw0LjI4MjAzIDYuODQxMzlMNC4xOTI0NSA2LjgzMzMzWk04Ljg4MzI5IDYuODMzMzNINy4wNjU1OUw2Ljk3NiA2Ljg0MTM5QzYuODAxNjIgNi44NzMxNCA2LjY1ODg1IDYuOTk1OTEgNi41OTgzNyA3LjE1ODg3TDYuNTc1MjIgNy4yNDM0Nkw2LjU2NzE5IDcuMzMzMzNWOS4wODMzM0w2LjU3NTIyIDkuMTczMjFDNi42MDY4NyA5LjM0ODE1IDYuNzI5MjUgOS40OTEzNyA2Ljg5MTY4IDkuNTUyMDVMNi45NzYgOS41NzUyOEw3LjA2NTU5IDkuNTgzMzNIOC44ODMyOUw4Ljk3Mjg4IDkuNTc1MjhDOS4xNDcyNiA5LjU0MzUzIDkuMjkwMDMgOS40MjA3NSA5LjM1MDUxIDkuMjU3OEw5LjM3MzY3IDkuMTczMjFMOS4zODE3IDkuMDgzMzNWNy4zMzMzM0w5LjM3MzY3IDcuMjQzNDZDOS4zNDIwMiA3LjA2ODUyIDkuMjE5NjQgNi45MjUyOSA5LjA1NzIgNi44NjQ2MUw4Ljk3Mjg4IDYuODQxMzlMOC44ODMyOSA2LjgzMzMzWk0xMy41NzQxIDYuODMzMzNIMTEuNzU2NEwxMS42NjY4IDYuODQxMzlDMTEuNDkyNSA2Ljg3MzE0IDExLjM0OTcgNi45OTU5MSAxMS4yODkyIDcuMTU4ODdMMTEuMjY2MSA3LjI0MzQ2TDExLjI1OCA3LjMzMzMzVjkuMDgzMzNMMTEuMjY2MSA5LjE3MzIxQzExLjI5NzcgOS4zNDgxNSAxMS40MjAxIDkuNDkxMzcgMTEuNTgyNSA5LjU1MjA1TDExLjY2NjggOS41NzUyOEwxMS43NTY0IDkuNTgzMzNIMTMuNTc0MUwxMy42NjM3IDkuNTc1MjhDMTMuODM4MSA5LjU0MzUzIDEzLjk4MDkgOS40MjA3NSAxNC4wNDE0IDkuMjU3OEwxNC4wNjQ1IDkuMTczMjFMMTQuMDcyNSA5LjA4MzMzVjcuMzMzMzNMMTQuMDY0NSA3LjI0MzQ2QzE0LjAzMjkgNy4wNjg1MiAxMy45MTA1IDYuOTI1MjkgMTMuNzQ4IDYuODY0NjFMMTMuNjYzNyA2Ljg0MTM5TDEzLjU3NDEgNi44MzMzM1oiIGZpbGw9IiM1ODY1N0MiLz4KPHBhdGggZD0iTTEzLjA1MjIgMS4xMjVIMTUuMDQ1OEMxNS41OTYzIDEuMTI1IDE2LjA0MjYgMS42MDA3IDE2LjA0MjYgMi4xODc1VjRIMC4wOTM3NVYyLjE4NzVDMC4wOTM3NSAxLjYwMDcgMC41NDAwMzUgMS4xMjUgMS4wOTA1NiAxLjEyNUgzLjA4NDE3VjEuMDYyNUMzLjA4NDE3IDAuNDc1Njk3IDMuNTMwNDUgMCA0LjA4MDk3IDBDNC42MzE0OSAwIDUuMDc3NzggMC40NzU2OTcgNS4wNzc3OCAxLjA2MjVWMS4xMjVIMTEuMDU4NlYxLjA2MjVDMTEuMDU4NiAwLjQ3NTY5NyAxMS41MDQ5IDAgMTIuMDU1NCAwQzEyLjYwNTkgMCAxMy4wNTIyIDAuNDc1Njk3IDEzLjA1MjIgMS4wNjI1VjEuMTI1WiIgZmlsbD0iIzU4NjU3QyIvPgo8L3N2Zz4K);
}
.form-star-rating-star.Stars {
background-image: url(data:image/png;base64,iVBORw0KGgoAAAANSUhEUgAAAKAAAAAeCAYAAACrDxUoAAAACXBIWXMAAAsTAAALEwEAmpwYAAAAAXNSR0IArs4c6QAAAARnQU1BAACxjwv8YQUAAAvDSURBVHgB7VtLbBvXFb1vZjgiRdEmlcKWYQWlDLuo0QamC7SRW7sdpg0QO4uiaLsoGsBysq/RbQtEYpCkyMpJurY+aLpogtbdSAaapGTzge1kYW4KJ0g/TGpbNm2JlEiK5Pxe7x1xBIqixuIbkkKbHGDA+b13+O6cOe/NuzMAX+AL/K/i3Q8+Ov/etY8uwC4h/9bo+XtvP/y55b/71uil3Yx/6cTJ86snTvniZyCI9Ic3tKCkpGnd1M3kqRNHM9BHLL45qinqcIN/OXng8ZsZ6CMcfoXaz8A0jf7z/+XghCSxmX/F0rsS/8LJk1pg30ia47p5+04ydvW9DAhAAkEonE3G9kYgFo0AyGwS+gyZwWRo/xmghdahzyDOcGQYwpHYrvBL0jrnrsWfw6T6zNMwgIuf9gsJkNxPkWUtMhSCSDgEtP7ulRsa9AnkPiwwrKmxR4EWWqd90Cc4/LKihUIRoIXJgf7yo/sFQ3vitL4b8Sf3k/aPaIEzp4EWdmBEK4yf1EAAQgJ03c9Fv+9C1/1c9NsFXfdz0W8XJPcjThd9j3/D/Vz4ccGOBdjsfi76eRc2u5+Lfrpgs/u56KcLuu4ny4GNff2Mf7P7ufDjgh0LsNX9XPTrLmx1Pxf9csFW93PRLxdsdT8XfYt/i/u5EHXBjgTYzv1c9OMubOd+Lvrhgu3cz0U/XLCd+7noR/zbuZ8LURfcsQDT169H0f0utHM/F+5dmL5yIw5dxr/T0ajE4EI793PhuuBieiQOPeJv534uXBfsBT/VuZ37uehl/AuaFpVsuNDO/Vy4LlgYH4/DDrFpHpBEBkY4DmAlFGB78WCCry9RmbF4ZGgQHort8axwqbAKK6UKrvEiVp/FOnIW55/aMs+CreQgUMkljx8vtitLFzmM/JYMCZmzvTawBAOeAMajjA3G1eFHYfDAjz351xb/CPX7GWoYcWSxjhwnfmZlA7aUqyD/WLLYOT/I8eBgBCJ7vuTJX169D2uVFd/8YLM4Y+zLxI91xYFJURLfYDi6cX5+8Z9gfv3v0K34k8hA1+O4mlC4tJdLHK89SwBnUWkoHCeXGzj/C/BC/dVXQf/DG7RaxCBk8X9g+xnysyxYVg5UNRfLZDb4HQG+++HHkxikCRKZJEugBgIQUGQ8NwASY84vbXcCw7RwgtbC9hhgWlZj2wTdMJ3g2DZLfW/8qy/TuXffHsWxA58gkTF5EOTQQZDUYZCDoyDJofXtwEOd0INtLIGtL4NVvQVWY93Zrt10xGFznhp5/NZmfhQZQ5sJBFTkDYASGMD2S/irQrtuzwuWZeBigmnUnV+btrH9pql78suy4vDS/6DfgLLOTdutaCdAkfiXvn1yEm+UCRIZRIZAPnwYu9MDIB85AqxpuxPwxUWw79wB65N/gI3r7raN24gi6i2198r7LyvrZ3MNxxDxfQ9FoVsgwdISCqpbjt1bKkZLleoPcdUJAOOgBWLj8fDoU9AtkGBpUcJHthyr3HwtahSubeIfwLHVnug+6BZINLSo6tbx8moxH61XSz3l7yT+HPnVJ5+IB3/9K+gWHAHTcvz4lmO1F16MGvOXHX7ntjItfq5cqWYLKyXoNYgDG58lTnefZZjn9MK1bPXuZeg1asihL1/LEmczf61aylZKBeg1iKO2VmrDX871g79t/DnGf+Fytn5xBnqN+vQMEBdx0rYjwOSJozkzUE0WVso9FSHVTRzERZzu/gOn7+RUWUnW8gs9FSGJr3p3IbtWLieJs5W/Ul7uqQip7kppuS2/bRjIX+ipCLeLf+zq1ZytKsn69HRPRUjiq1+czhIXcdK+LQ8hihFKD4VDiW52xwS0/fU7jxq/3SA4HY/qlpnGKZVEN7tjQuU/vwe9cNW5+GM/KnryB0ORRDe7QwJ2u47z7YQ/PDSc8HradeE1BmzFjuJPT7o6xv/M6UQ3u2NC7YXfoPMtrIuv6SFk08iW/hj9wXK5eim/VIRuodH4tFfjCbFkrkhOpBc+uITjNOgWSHz14tW018Vv5sfu8BIJpluguqrVUman/N124kb8Mw+MPwqDBILjsz/jOA26BRKfMb+QaRUfYdvXsd65dmMGp10m/DihbdvOtMBqeW32u48ePddJ2btvHZxRY+MTfpyQW2uwdvsS6MUrs/t/cKtjfpz0nfDjhBzbX8JpmVp1dQ75J3ZaznXCUDiaiOzZ/un/QQ7YFP85jP8EdICVE9+ZVZ88c9aPE/JyGeqv/Bb0+fk5fOKdaHfOthPRJJgSCsePE4qKj0CCwS5z1o8Tri3+SUh8Lj8KZ9aPE4qIj+A6YbVSRCdcBlGIio9AgtHnF+b8OGH9lVc9xUfwzIRYNqRqdR1EQWUtFVIgCNuwUmblExCFWf4E6wj44jf0KojC0GvEPwUCIBHaHH6p++BvxH8KBGFza8q6fh1EYWJZqsPrHO9UnAJxzC+CKBjmrsCQxftwRYl3OgG9iZ8msWXDH7+sgCgwk+GLH5MAUSbtbvzZyAiIgg0NoYtJnvyeApQsnhhQO8sANGMAMyqSbWsgCEpDycGDIArKpNgMNBAE8VM2QhRU1g8/ZksSlAkRhd/40/WXjhwBUVAmRVKY5nWOtwNKUlxRxO9ASuFhBOIgCkoNqsMgCgVTeKiiOIgC+WUfDkgpPD/86IDHZB83QFfi78MBpSOHnTo8z3nAwWOUFxYFlZVAOgaCIH45NOpxBm8s7UFlJWC++P06oB9+bBsOgcRvAL/xxxHEMfkr/hwQ04ye/Nu2Lk2DTwOwC956Cj3e0xsXuHAJk+SYR2btXtNaL8sS6es3cI7xKHQCnIoAwzITSnCrALlVgdr9d6C+lOY0zlOj4yy0/wlonVWiLpje5lm8HMdsQw46gcsfULYKkKZX6I0XfEp1XhLA6RpoN3FMZYkfBNCYimk7BCB+zJo465/dzjvvAnrFH0TBoW0XTNMr9MaL8cbrzjhPOX0GBp7ZOtHglGXe7fdywCiKi5aNHSQ8Sudgo3lxpTyjG/ahWt08tFwszdK+UmVtc+VYFsfBNAiNQ+eIooVFSWAuSHiUqlv5OMWr+fkZq1Y6ZFbyh9buzM+ufDzF64Vr0OyIVBYXcX5sf/NbKM6FxwnipfynUC4vzZq6PmbUamOl1aU52oeZjk0VMKf9UhRvgDh0iJppJlq7X5c/f28JCrV9s8vyz8cw/mMY/zkS4nbxRwOIQ4egrAiKK+o8SLj8NK+HqbrKT34K+vTFWXOlOGbcujlWv3hxjvYZC5vTqFSW6vB6P3B7fzeDCbXJ/cjxUHwYA57B7PVzLd+hnktfuZHK3y9OYq7xbGzvEIuEB50DQXobo1YnG85BB6ALoA6NNbY41O//Dar5BW5b1Qzn8NyBx29lmvkXL1up8me/m8R88tngvjNsIPYtCoHzNozEs0L8AwPBjW1yvDWck7O4TfypFv6JxcsjU0Xj7lSgvHwWU2lA7w4SAireBKzUMT89Abvjz2bHLUuPZO4Hnkp989TPMgB/xaMvOfwY/ymM/1Qj/uA3/oDtl752eGNTf/0NFN008NVyxsL2x66+n2k6ewJFNmU9/8IUnnNWffppcN+alr9xHPg7723Lv60A3SdguquwUdw0rXbC20Ajue0I8d7SyjSW0UiIAUWBslUfgw7hPgGTq6GouKUvN4TX/gPwRnLfEWL15mvTWEYjIUqBYdAtJsRP3R+5GnZ33LSMnfA7QixZ+RlMp2kkRBnbX6t1zs+Ba/QETI5HwqtJD2eK6unUI6deygDMbzm/EX9HiBj/mUb8QTT+7hMwuVqdhHf7TkN47T9Ab7xc4AjRfv7FGRSiRkKkaRzO7W35PUe4NMbDH0/htaIRiMfo2wQMxLO4rskKE0ps1pfomoPnhW9FQwiPLb4JGgrxWSyv4WBaiL9aWeFrYvxJ+jaktJKfFOVHziKN8xrtTz38fXKc9x9YrhH/ZCP+9JGQcPwNdD2Dg6fwWtEQYpK+DUEhTuKdrOFcplhi+0oXvi3wU4fI2Kmbdfw/8PuJfyffdojW8V+eSSW+hhteKQAAAABJRU5ErkJggg==) !important;
}
.signature-pad-passive, .signature-placeholder:after {
background-image: url(data:image/svg+xml;base64,PHN2ZyB3aWR0aD0iMTk4IiBoZWlnaHQ9IjQwIiB2aWV3Qm94PSIwIDAgMTk4IDQwIiBmaWxsPSJub25lIiB4bWxucz0iaHR0cDovL3d3dy53My5vcmcvMjAwMC9zdmciPgo8cGF0aCBkPSJNNzQuMTA0NCA2LjM0NTA4SDc1LjU4NTlDNzUuNTQxMiA0LjcxNDQgNzQuMDk5NCAzLjUzMTE2IDcyLjAzMTIgMy41MzExNkM2OS45ODc5IDMuNTMxMTYgNjguNDIxOSA0LjY5OTQ4IDY4LjQyMTkgNi40NTQ0NkM2OC40MjE5IDcuODcxMzYgNjkuNDM2MSA4LjcwMTYyIDcxLjA3MTcgOS4xNDQwOUw3Mi4yNzQ5IDkuNDcyMjFDNzMuMzYzNiA5Ljc2MDU2IDc0LjIwMzggMTAuMTE4NSA3NC4yMDM4IDExLjAyMzNDNzQuMjAzOCAxMi4wMTc3IDczLjI1NDMgMTIuNjczOSA3MS45NDY3IDEyLjY3MzlDNzAuNzYzNSAxMi42NzM5IDY5Ljc3OTEgMTIuMTQ2OSA2OS42ODk2IDExLjAzODNINjguMTQ4NEM2OC4yNDc5IDEyLjg4MjcgNjkuNjc0NyAxNC4wMjEyIDcxLjk1NjcgMTQuMDIxMkM3NC4zNDggMTQuMDIxMiA3NS43MjUxIDEyLjc2MzQgNzUuNzI1MSAxMS4wMzgzQzc1LjcyNTEgOS4yMDM3NSA3NC4wODk1IDguNDkyODEgNzIuNzk2OSA4LjE3NDYzTDcxLjgwMjYgNy45MTYxQzcxLjAwNzEgNy43MTIyNyA2OS45NDgyIDcuMzM5NCA2OS45NTMxIDYuMzY0OTdDNjkuOTUzMSA1LjQ5OTkxIDcwLjc0MzYgNC44NTg1OCA3MS45OTY0IDQuODU4NThDNzMuMTY0OCA0Ljg1ODU4IDczLjk5NSA1LjQwNTQ1IDc0LjEwNDQgNi4zNDUwOFoiIGZpbGw9IiM4Nzk1QUIiLz4KPHBhdGggZD0iTTc3LjQ0MTYgMTMuODUyMkg3OC45MjgxVjYuMjE1ODJINzcuNDQxNlYxMy44NTIyWk03OC4xOTIzIDUuMDM3NTVDNzguNzA0NCA1LjAzNzU1IDc5LjEzMTkgNC42Mzk4MyA3OS4xMzE5IDQuMTUyNjFDNzkuMTMxOSAzLjY2NTM5IDc4LjcwNDQgMy4yNjI3IDc4LjE5MjMgMy4yNjI3Qzc3LjY3NTIgMy4yNjI3IDc3LjI1MjcgMy42NjUzOSA3Ny4yNTI3IDQuMTUyNjFDNzcuMjUyNyA0LjYzOTgzIDc3LjY3NTIgNS4wMzc1NSA3OC4xOTIzIDUuMDM3NTVaIiBmaWxsPSIjODc5NUFCIi8+CjxwYXRoIGQ9Ik04NC4xMjk2IDE2Ljg2Qzg2LjA3MzUgMTYuODYgODcuNTc0OSAxNS45NzAxIDg3LjU3NDkgMTQuMDIxMlY2LjIxNTgySDg2LjExODNWNy40NTM3NUg4Ni4wMDg5Qzg1Ljc0NTQgNi45ODE0NSA4NS4yMTg0IDYuMTE2MzkgODMuNzk2NSA2LjExNjM5QzgxLjk1MjEgNi4xMTYzOSA4MC41OTQ4IDcuNTczMDYgODAuNTk0OCAxMC4wMDQyQzgwLjU5NDggMTIuNDQwMyA4MS45ODE5IDEzLjczNzggODMuNzg2NiAxMy43Mzc4Qzg1LjE4ODYgMTMuNzM3OCA4NS43MzA1IDEyLjk0NzQgODUuOTk4OSAxMi40NjAxSDg2LjA5MzRWMTMuOTYxNkM4Ni4wOTM0IDE1LjEzOTggODUuMjczMSAxNS42NjE4IDg0LjE0NDUgMTUuNjYxOEM4Mi45MDY2IDE1LjY2MTggODIuNDI0NCAxNS4wNDA0IDgyLjE2MDkgMTQuNjE3OEw4MC44ODMyIDE1LjE0NDhDODEuMjg1OSAxNi4wNjQ1IDgyLjMwNSAxNi44NiA4NC4xMjk2IDE2Ljg2Wk04NC4xMTQ3IDEyLjUwNDlDODIuNzg3MyAxMi41MDQ5IDgyLjA5NjIgMTEuNDg1NyA4Mi4wOTYyIDkuOTg0MjlDODIuMDk2MiA4LjUxNzY3IDgyLjc3MjQgNy4zNzkxNyA4NC4xMTQ3IDcuMzc5MTdDODUuNDEyMyA3LjM3OTE3IDg2LjEwODMgOC40MzgxMiA4Ni4xMDgzIDkuOTg0MjlDODYuMTA4MyAxMS41NjAzIDg1LjM5NzQgMTIuNTA0OSA4NC4xMTQ3IDEyLjUwNDlaIiBmaWxsPSIjODc5NUFCIi8+CjxwYXRoIGQ9Ik05MS4wNTUgOS4zMTgwOUM5MS4wNTUgOC4xMDAwNSA5MS44MDA4IDcuNDA0MDMgOTIuODM0OSA3LjQwNDAzQzkzLjg0NDEgNy40MDQwMyA5NC40NTU2IDguMDY1MjUgOTQuNDU1NiA5LjE3MzkyVjEzLjg1MjJIOTUuOTQyMVY4Ljk5NDk0Qzk1Ljk0MjEgNy4xMDU3NCA5NC45MDMxIDYuMTE2MzkgOTMuMzQyIDYuMTE2MzlDOTIuMTkzNSA2LjExNjM5IDkxLjQ0MjggNi42NDgzNSA5MS4wODk4IDcuNDU4NzJIOTAuOTk1NFY2LjIxNTgySDg5LjU2ODVWMTMuODUyMkg5MS4wNTVWOS4zMTgwOVoiIGZpbGw9IiM4Nzk1QUIiLz4KPHBhdGggZD0iTTEwMS43NiAxMy44NTIySDEwMy4yOTZWOS40MTI1NUgxMDguMzcyVjEzLjg1MjJIMTA5LjkxNFYzLjY3MDM3SDEwOC4zNzJWOC4wOTUwOEgxMDMuMjk2VjMuNjcwMzdIMTAxLjc2VjEzLjg1MjJaIiBmaWxsPSIjODc5NUFCIi8+CjxwYXRoIGQ9Ik0xMTUuMzIzIDE0LjAwNjNDMTE2Ljk4OCAxNC4wMDYzIDExOC4xNjYgMTMuMTg2IDExOC41MDQgMTEuOTQzMUwxMTcuMDk3IDExLjY4OTVDMTE2LjgyOSAxMi40MTA0IDExNi4xODMgMTIuNzc4MyAxMTUuMzM4IDEyLjc3ODNDMTE0LjA2NSAxMi43NzgzIDExMy4yMSAxMS45NTMgMTEzLjE3IDEwLjQ4MTRIMTE4LjU5OVY5Ljk1NDQ2QzExOC41OTkgNy4xOTUyMiAxMTYuOTQ4IDYuMTE2MzkgMTE1LjIxOCA2LjExNjM5QzExMy4wOSA2LjExNjM5IDExMS42ODggNy43MzcxMyAxMTEuNjg4IDEwLjA4MzdDMTExLjY4OCAxMi40NTUyIDExMy4wNyAxNC4wMDYzIDExNS4zMjMgMTQuMDA2M1pNMTEzLjE3NSA5LjM2NzgxQzExMy4yMzUgOC4yODQgMTE0LjAyIDcuMzQ0MzcgMTE1LjIyOCA3LjM0NDM3QzExNi4zODIgNy4zNDQzNyAxMTcuMTM3IDguMTk5NDkgMTE3LjE0MiA5LjM2NzgxSDExMy4xNzVaIiBmaWxsPSIjODc5NUFCIi8+CjxwYXRoIGQ9Ik0xMjAuMjQ4IDEzLjg1MjJIMTIxLjczNVY5LjE4ODgzQzEyMS43MzUgOC4xODk1NCAxMjIuNTA1IDcuNDY4NjYgMTIzLjU1OSA3LjQ2ODY2QzEyMy44NjggNy40Njg2NiAxMjQuMjE2IDcuNTIzMzUgMTI0LjMzNSA3LjU1ODE1VjYuMTM2MjdDMTI0LjE4NiA2LjExNjM5IDEyMy44OTIgNi4xMDE0NyAxMjMuNzAzIDYuMTAxNDdDMTIyLjgwOSA2LjEwMTQ3IDEyMi4wNDMgNi42MDg1OCAxMjEuNzY1IDcuNDI4ODlIMTIxLjY4NVY2LjIxNTgySDEyMC4yNDhWMTMuODUyMloiIGZpbGw9IiM4Nzk1QUIiLz4KPHBhdGggZD0iTTEyOC42MzkgMTQuMDA2M0MxMzAuMzA1IDE0LjAwNjMgMTMxLjQ4MyAxMy4xODYgMTMxLjgyMSAxMS45NDMxTDEzMC40MTQgMTEuNjg5NUMxMzAuMTQ1IDEyLjQxMDQgMTI5LjQ5OSAxMi43NzgzIDEyOC42NTQgMTIuNzc4M0MxMjcuMzgxIDEyLjc3ODMgMTI2LjUyNiAxMS45NTMgMTI2LjQ4NiAxMC40ODE0SDEzMS45MTVWOS45NTQ0NkMxMzEuOTE1IDcuMTk1MjIgMTMwLjI2NSA2LjExNjM5IDEyOC41MzUgNi4xMTYzOUMxMjYuNDA3IDYuMTE2MzkgMTI1LjAwNSA3LjczNzEzIDEyNS4wMDUgMTAuMDgzN0MxMjUuMDA1IDEyLjQ1NTIgMTI2LjM4NyAxNC4wMDYzIDEyOC42MzkgMTQuMDA2M1pNMTI2LjQ5MSA5LjM2NzgxQzEyNi41NTEgOC4yODQgMTI3LjMzNiA3LjM0NDM3IDEyOC41NDUgNy4zNDQzN0MxMjkuNjk4IDcuMzQ0MzcgMTMwLjQ1NCA4LjE5OTQ5IDEzMC40NTkgOS4zNjc4MUgxMjYuNDkxWiIgZmlsbD0iIzg3OTVBQiIvPgo8cGF0aCBkPSJNMSAzNi4wMjI5QzEyLjI0NjEgMzkuMjIwNSAyMy4xODIgMzUuMDMyOCAzMi41MDg0IDI4Ljg1MTFDMzcuNDQwNCAyNS41ODIyIDQyLjMzNDEgMjEuNjY4NyA0NS4zMzI5IDE2LjUxMDFDNDYuNTI4MyAxNC40NTM5IDQ3Ljk4OTMgMTAuODg0NCA0NC4yMjcxIDEwLjg1MjhDNDAuMTMzNyAxMC44MTgzIDM3LjA4NjQgMTQuNTE0MiAzNS41NTg4IDE3Ljg3NDRDMzMuMzY4MSAyMi42OTMzIDMzLjI5MSAyOC40MDA0IDM1Ljk2NTYgMzMuMDQ0MUMzOC40OTcxIDM3LjQzOTYgNDIuNzQ0NSAzOS41MTg0IDQ3LjgxMTQgMzguNjYzOUM1My4xMDM3IDM3Ljc3MTMgNTcuNzMwNCAzNC4xNTYyIDYxLjU3NjUgMzAuNjc4NUM2Mi45OTMgMjkuMzk3NiA2NC4zMjA5IDI4LjA0NzUgNjUuNTQyIDI2LjU4NTdDNjUuNjg0MiAyNi40MTU1IDY2LjE4NDIgMjUuNTc5OCA2Ni41MDggMjUuNTIxOEM2Ni42Mjg0IDI1LjUwMDIgNjYuODA2NCAyOS4xNjQ1IDY2LjgzODUgMjkuMzY0M0M2Ny4xMjU1IDMxLjE1NDMgNjguMDI5NCAzMy4xNzA2IDcwLjE0MzEgMzMuMjMxOEM3Mi44MzMyIDMzLjMwOTcgNzUuMDgyNiAzMS4wNTkxIDc2Ljg5MjIgMjkuNDAxOEM3Ny41MDI2IDI4Ljg0MjggNzkuNDQyNSAyNi4xNjAxIDgwLjQ3NjQgMjYuMTYwMUM4MC45MDE0IDI2LjE2MDEgODEuNzI0OSAyOC4zMDM4IDgxLjkxMjcgMjguNTg4M0M4NC4zOTcyIDMyLjM1MjMgODguMDQ0NiAzMC45ODk0IDkwLjg3MzMgMjguMzUwNUM5MS4zOTM0IDI3Ljg2NTMgOTQuMTc4MSAyMy45ODM5IDk1LjMwOTEgMjQuNjgzMkM5Ni4yMjAzIDI1LjI0NjYgOTYuNjIxNyAyNi41NzY1IDk3LjA4ODYgMjcuNDYxOEM5Ny44NDg0IDI4LjkwMjkgOTguODEwNyAyOS45Mjk0IDEwMC40MTkgMzAuNDY1N0MxMDMuOTEyIDMxLjYzMSAxMDcuNjggMjguMzYzIDExMS4yMjIgMjguMzYzQzExMi4yNTUgMjguMzYzIDExMi43ODMgMjguOTMxNiAxMTMuMzMyIDI5LjcxNDhDMTE0LjA4MSAzMC43ODIzIDExNC44NTMgMzEuNTI3NiAxMTYuMjA1IDMxLjgxNzVDMTIwLjM5MyAzMi43MTU1IDEyMy44MjIgMjguNzM5OSAxMjcuODcyIDI5LjA4ODlDMTI5LjA1MyAyOS4xOTA3IDEyOS45MzUgMzAuMzgxNiAxMzAuODIxIDMxLjAxNjRDMTMyLjYwOSAzMi4yOTY5IDEzNC43NTkgMzMuMTgzNiAxMzYuOTQ4IDMzLjQ5NDdDMTQwLjQ1NyAzMy45OTM0IDE0My45NzUgMzMuMzMyNiAxNDcuMzk1IDMyLjU5MzVDMTUzLjMgMzEuMzE3NCAxNTkuMTQ3IDI5Ljc5NTggMTY1LjA2MiAyOC41NjMzIiBzdHJva2U9IiNERkUzRUQiIHN0cm9rZS13aWR0aD0iMS41IiBzdHJva2UtbGluZWNhcD0icm91bmQiIHN0cm9rZS1saW5lam9pbj0icm91bmQiLz4KPHBhdGggZD0iTTE5Ni41MTUgMTUuMDc3OEwxODQuNDkyIDAuNTUxNzk1QzE4NC4yNTcgMC4yNjc4MSAxODMuODM4IDAuMjI4MjYgMTgzLjU1NCAwLjQ2MzMwN0wxODAuNjQ5IDIuODY3ODhDMTgwLjM2NSAzLjEwMjkzIDE4MC4zMjUgMy41MjI0IDE4MC41NiAzLjgwNjM4TDE5Mi41ODMgMTguMzMyNEMxOTIuNyAxOC40NzQxIDE5Mi44NjQgMTguNTU1MSAxOTMuMDM0IDE4LjU3MTJDMTkzLjIwNCAxOC41ODcyIDE5My4zOCAxOC41MzgyIDE5My41MjIgMTguNDIwOUwxOTYuNDI3IDE2LjAxNjRDMTk2LjcxMSAxNS43ODEzIDE5Ni43NSAxNS4zNjE4IDE5Ni41MTUgMTUuMDc3OFoiIGZpbGw9IiNERkUzRUQiLz4KPHBhdGggZD0iTTE4MS40MzYgNi45NTc2OUwxNzAuODU1IDkuODI2NDJDMTcwLjYyMiA5Ljg4OTUgMTcwLjQ0MSAxMC4wNzMzIDE3MC4zODMgMTAuMzA3NkwxNjYuMTU1IDI3LjEwMjFMMTczLjk3NSAyMC42Mjk2QzE3My4yNDUgMTkuMjYxNyAxNzMuNTUgMTcuNTE5NCAxNzQuNzkgMTYuNDkyNkMxNzYuMjA2IDE1LjMyMDMgMTc4LjMxMiAxNS41MTk2IDE3OS40ODMgMTYuOTM1MUMxODAuNjU1IDE4LjM1MTMgMTgwLjQ1NiAyMC40NTY2IDE3OS4wNDEgMjEuNjI4MkMxNzguMzMzIDIyLjIxNDQgMTc3LjQ1MiAyMi40NTgyIDE3Ni42MDMgMjIuMzc4MUMxNzUuOTY0IDIyLjMxNzkgMTc1LjM0MyAyMi4wNzQ1IDE3NC44MjUgMjEuNjU3M0wxNjcuMDA1IDI4LjEyOTFMMTg0LjI5NCAyNy4xMTQyQzE4NC41MzQgMjcuMTAwMSAxODQuNzQ5IDI2Ljk1NzYgMTg0Ljg1NCAyNi43NDA2TDE4OS42NSAxNi44ODE5TDE4MS40MzYgNi45NTc2OVoiIGZpbGw9IiNERkUzRUQiLz4KPC9zdmc+Cg==);
}
.form-spinner-button.form-spinner-up:before {
background-image: url(data:image/svg+xml;base64,PHN2ZyB3aWR0aD0iMTQiIGhlaWdodD0iMTQiIHZpZXdCb3g9IjAgMCAxNCAxNCIgZmlsbD0ibm9uZSIgeG1sbnM9Imh0dHA6Ly93d3cudzMub3JnLzIwMDAvc3ZnIj4KPHBhdGggZmlsbC1ydWxlPSJldmVub2RkIiBjbGlwLXJ1bGU9ImV2ZW5vZGQiIGQ9Ik03LjUgMTIuNUw3LjUgNy41TDEyLjUgNy41QzEyLjc3NiA3LjUgMTMgNy4yNzYgMTMgN0MxMyA2LjcyNCAxMi43NzYgNi41IDEyLjUgNi41TDcuNSA2LjVMNy41IDEuNUM3LjUgMS4yMjQgNy4yNzYgMSA3IDFDNi43MjQgMSA2LjUgMS4yMjQgNi41IDEuNUw2LjUgNi41TDEuNSA2LjVDMS4yMjQgNi41IDAuOTk5OTk5IDYuNzI0IDAuOTk5OTk5IDdDMC45OTk5OTkgNy4yNzYgMS4yMjQgNy41IDEuNSA3LjVMNi41IDcuNUw2LjUgMTIuNUM2LjUgMTIuNzc2IDYuNzI0IDEzIDcgMTNDNy4yNzYgMTMgNy41IDEyLjc3NiA3LjUgMTIuNVoiIGZpbGw9IiM1NjY1N0UiIHN0cm9rZT0iIzU2NjU3RSIgc3Ryb2tlLXdpZHRoPSIwLjUiLz4KPC9zdmc+Cg==);
}
.form-spinner-button.form-spinner-down:before {
background-image: url(data:image/svg+xml;base64,PHN2ZyB3aWR0aD0iMTQiIGhlaWdodD0iMyIgdmlld0JveD0iMCAwIDE0IDMiIGZpbGw9Im5vbmUiIHhtbG5zPSJodHRwOi8vd3d3LnczLm9yZy8yMDAwL3N2ZyI+CjxwYXRoIGQ9Ik0xMi41IDJMNy41IDJMMS41IDJDMS4yMjQgMiAxIDEuNzc2IDEgMS41QzEgMS4yMjQgMS4yMjQgMC45OTk5OTkgMS41IDAuOTk5OTk5TDYuNSAxTDEyLjUgMUMxMi43NzYgMSAxMyAxLjIyNCAxMyAxLjVDMTMgMS43NzYgMTIuNzc2IDIgMTIuNSAyWiIgZmlsbD0iIzU2NjU3RSIgc3Ryb2tlPSIjNTY2NTdFIiBzdHJva2Utd2lkdGg9IjAuNSIvPgo8L3N2Zz4K);
}
.form-collapse-table:after{
background-image: url(data:image/svg+xml;base64,PHN2ZyB3aWR0aD0iMTEiIGhlaWdodD0iMTEiIHZpZXdCb3g9IjAgMCAxMSAxMSIgZmlsbD0ibm9uZSIgeG1sbnM9Imh0dHA6Ly93d3cudzMub3JnLzIwMDAvc3ZnIj4KPGNpcmNsZSBjeD0iNS41IiBjeT0iNS41IiByPSI1LjUiIHRyYW5zZm9ybT0icm90YXRlKC05MCA1LjUgNS41KSIgZmlsbD0iI0MzQ0FEOCIgZmlsbC1vcGFjaXR5PSIwLjUiLz4KPHBhdGggZD0iTTMuMTY3NTYgNC40NjExMkMzLjE0NzkzIDQuNTAzMDggMy4xMzk2MSA0LjU1MDA4IDMuMTQzNTIgNC41OTY4M0MzLjE0NzQzIDQuNjQzNTggMy4xNjM0MyA0LjY4ODI0IDMuMTg5NzIgNC43MjU3OUw1LjMxMTE1IDcuNzU2NEM1LjMzMzEgNy43ODc3NyA1LjM2MTU3IDcuODEzMjMgNS4zOTQzIDcuODMwNzZDNS40MjcwMyA3Ljg0ODI5IDUuNDYzMTIgNy44NTc0MiA1LjQ5OTcyIDcuODU3NDJDNS41MzYzMSA3Ljg1NzQyIDUuNTcyNCA3Ljg0ODI5IDUuNjA1MTMgNy44MzA3NkM1LjYzNzg2IDcuODEzMjMgNS42NjYzMyA3Ljc4Nzc3IDUuNjg4MjkgNy43NTY0TDcuODA5NzIgNC43MjU3OUM3Ljg0MDMyIDQuNjgyMDcgNy44NTY4NiA0LjYyODkgNy44NTY4NiA0LjU3NDI2QzcuODU2NzIgNC41MzQ5OSA3Ljg0ODE4IDQuNDk2MjkgNy44MzE4OCA0LjQ2MTEyQzcuODEyMjggNC40MTkyMiA3Ljc4MjE5IDQuMzgzOTkgNy43NDQ5OCA0LjM1OTM3QzcuNzA3NzYgNC4zMzQ3NSA3LjY2NDg5IDQuMzIxNzEgNy42MjExNSA0LjMyMTcxTDMuMzc4MjkgNC4zMjE3MUMzLjMzNDU1IDQuMzIxNzEgMy4yOTE2NyA0LjMzNDc1IDMuMjU0NDYgNC4zNTkzN0MzLjIxNzI0IDQuMzgzOTkgMy4xODcxNSA0LjQxOTIyIDMuMTY3NTYgNC40NjExMlY0LjQ2MTEyWiIgZmlsbD0iI0U1RTdGMSIvPgo8L3N2Zz4K);
}
li[data-type=control_fileupload] .qq-upload-button:before {
background-image: url(data:image/svg+xml;base64,PHN2ZyB3aWR0aD0iMzkiIGhlaWdodD0iMjciIHZpZXdCb3g9IjAgMCAzOSAyNyIgZmlsbD0ibm9uZSIgeG1sbnM9Imh0dHA6Ly93d3cudzMub3JnLzIwMDAvc3ZnIj4KPHBhdGggZD0iTTMyLjM3NSAxMS4zMTI1QzMxLjUgNC44MTI1IDI2IDAgMTkuMzc1IDBDMTMuNjg3NSAwIDguNzUgMy41NjI1IDYuOTM3NSA4LjkzNzVDMi44NzUgOS44MTI1IDAgMTMuMzEyNSAwIDE3LjVDMCAyMi4wNjI1IDMuNTYyNSAyNS44NzUgOC4xMjUgMjYuMjVIMzEuODc1SDMxLjkzNzVDMzUuNzUgMjUuODc1IDM4Ljc1IDIyLjYyNSAzOC43NSAxOC43NUMzOC43NSAxNS4wNjI1IDM2IDExLjg3NSAzMi4zNzUgMTEuMzEyNVpNMjYuMDYyNSAxNC44MTI1QzI1LjkzNzUgMTQuOTM3NSAyNS44MTI1IDE1IDI1LjYyNSAxNUMyNS40Mzc1IDE1IDI1LjMxMjUgMTQuOTM3NSAyNS4xODc1IDE0LjgxMjVMMjAgOS42MjVWMjEuODc1QzIwIDIyLjI1IDE5Ljc1IDIyLjUgMTkuMzc1IDIyLjVDMTkgMjIuNSAxOC43NSAyMi4yNSAxOC43NSAyMS44NzVWOS42MjVMMTMuNTYyNSAxNC44MTI1QzEzLjMxMjUgMTUuMDYyNSAxMi45Mzc1IDE1LjA2MjUgMTIuNjg3NSAxNC44MTI1QzEyLjQzNzUgMTQuNTYyNSAxMi40Mzc1IDE0LjE4NzUgMTIuNjg3NSAxMy45Mzc1TDE4LjkzNzUgNy42ODc1QzE5IDcuNjI1IDE5LjA2MjUgNy41NjI1IDE5LjEyNSA3LjU2MjVDMTkuMjUgNy41IDE5LjQzNzUgNy41IDE5LjYyNSA3LjU2MjVDMTkuNjg3NSA3LjYyNSAxOS43NSA3LjYyNSAxOS44MTI1IDcuNjg3NUwyNi4wNjI1IDEzLjkzNzVDMjYuMzEyNSAxNC4xODc1IDI2LjMxMjUgMTQuNTYyNSAyNi4wNjI1IDE0LjgxMjVaIiBmaWxsPSIjQjNCQ0NDIi8+Cjwvc3ZnPgo=);
}
.appointmentDayPickerButton {
background-image: url(data:image/svg+xml;base64,PHN2ZyB3aWR0aD0iOCIgaGVpZ2h0PSIxNCIgdmlld0JveD0iMCAwIDggMTQiIGZpbGw9Im5vbmUiIHhtbG5zPSJodHRwOi8vd3d3LnczLm9yZy8yMDAwL3N2ZyI+CjxwYXRoIGQ9Ik0xIDEzTDcgN0wxIDAuOTk5OTk5IiBzdHJva2U9IiM4Nzk1QUMiIHN0cm9rZS13aWR0aD0iMiIgc3Ryb2tlLWxpbmVjYXA9InJvdW5kIiBzdHJva2UtbGluZWpvaW49InJvdW5kIi8+Cjwvc3ZnPgo=);
}
/* NEW THEME STYLE */
/*PREFERENCES STYLE*/
/*PREFERENCES STYLE*/
.form-all {
font-family: Inter, sans-serif;
}
.form-all .qq-upload-button,
.form-all .form-submit-button,
.form-all .form-submit-reset,
.form-all .form-submit-print {
font-family: Inter, sans-serif;
}
.form-all .form-pagebreak-back-container,
.form-all .form-pagebreak-next-container {
font-family: Inter, sans-serif;
}
.form-header-group {
font-family: Inter, sans-serif;
}
.form-label {
font-family: Inter, sans-serif;
}
.form-label.form-label-auto {
display: block;
float: none;
text-align: left;
width: 100%;
}
.form-line {
margin-top: 6px 10px 7px 10pxpx;
margin-bottom: 6px 10px 7px 10pxpx;
}
.form-all {
max-width: 752px;
width: 100%;
}
.form-label.form-label-left,
.form-label.form-label-right,
.form-label.form-label-left.form-label-auto,
.form-label.form-label-right.form-label-auto {
width: 230px;
}
.form-all {
font-size: 16px
}
.form-all .qq-upload-button,
.form-all .qq-upload-button,
.form-all .form-submit-button,
.form-all .form-submit-reset,
.form-all .form-submit-print {
font-size: 16px
}
.form-all .form-pagebreak-back-container,
.form-all .form-pagebreak-next-container {
font-size: 16px
}
.supernova {
background-color: #F3F3FE;
}
.supernova body {
background: transparent;
}
.supernova .form-all, .form-all {
background-color: #FFFFFF;
}
.form-all {
color: #2C3345;
}
.form-header-group .form-header {
color: #2C3345;
}
.form-header-group .form-subHeader {
color: #2C3345;
}
.form-label-top,
.form-label-left,
.form-label-right,
.form-html,
.form-checkbox-item label,
.form-radio-item label {
color: #2C3345;
}
.form-sub-label {
color: #464d5f;
}
.form-textbox,
.form-textarea,
.form-dropdown,
.form-radio-other-input,
.form-checkbox-other-input,
.form-captcha input,
.form-spinner input {
background-color: #FFFFFF;
}
.form-line-error {
overflow: hidden;
transition: none;
background-color: #FFD6D6;
}
.form-line-error .form-error-message {
background-color: #FF3200;
clear: both;
float: none;
}
.form-line-error .form-error-arrow {
border-bottom-color: #FF3200;
}
.form-line-error input:not(#coupon-input),
.form-line-error textarea,
.form-line-error .form-validation-error {
border: 1px solid #FF3200;
.box-shadow(0 0 3px #FF3200);
}
.supernova {
background-image: none;
}
#stage {
background-image: none;
}
.form-all {
background-image: none;
}
.ie-8 .form-all:before { display: none; }
.ie-8 {
margin-top: auto;
margin-top: initial;
}
/*PREFERENCES STYLE*//*__INSPECT_SEPERATOR__*/
/* Injected CSS Code */
Comments are closed