

By Jim Lewis, CEO Enhanced Retail Solutions LLC
It’s always been challenging for suppliers to determine demand- and predicting what orders retailers will write. It’s even more complex determining demand across multiple channels. The forecasting logic is not the hard part- it’s the merging of accurate POS sales data across all the retailers and their tiers. Let’s take Amazon as an example. There are multiple ways to sell on Amazon including drop shipping and fulfilled by Amazon. Some of the sales data comes from the Amazon vendor portal, but drop information comes from the supplier’s ERP system. The same may be true for other retailers with multiple channels of distribution. You have to be careful not to “double dip” sales or the basis for your forecast will be inaccurate. There are many other “little” issues that impede the ability to build and maintain a forecast.
Wholesale Inventory
Wholesale inventory is managed very differently than retail inventory. If it’s shared, you need some discipline and organization to “set aside” inventory for each retailer and maybe even each tier within the retailer. Honestly, most manufacturers will be happy to sell the inventory no matter who wants it. I completely understand that, but you have to realize that could have an adverse effect on other listings you have for the item. There are no easy solutions for this and a case where there’s probably a spreadsheet somewhere that has the allocation.
Item Naming Convention Issues
Once POS data is collected and stored in your preferred platform, you must sum it all up to use as the basis of your forecast. Seems easy enough, but not so fast. The same item may have a different item number (or UPC) and description. An item may have multiple UPC’s based on how it is packed or for a million other reasons. You need a common (unique) identifier for each item. Many times, that can be the supplier’s style/vendor ID. A similar obstacle may exist with the item description. Each retailer may have their own description. Even internally, the supplier may call the same item something different for each retailer- or each channel at one retailer. This causes a problem when using a pivot table or visualization tool. Unless your brain has a built in M2 chip you probably don’t know every single item you sell just by the item number.
One way around this in Microsoft Excel is to copy the item number and description columns into another spreadsheet. Sort by item number and then remove duplicates on the item number column. Then on your main file, just vlookup the description and it will replace the multiple names with just the one from your removed duplicates file.
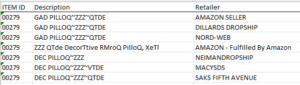
Multiple item descriptions for the same item number.
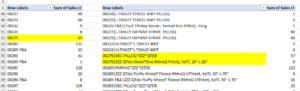
Multiple descriptions also cause a headache in Pivot Tables.
In Microsoft PowerBI it’s a lot simpler- just select the first description that comes up. Another reason to use more sophisticated tools rather than a spreadsheet!
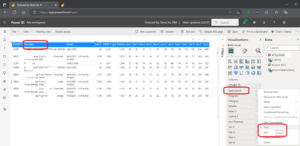
It’s far easier to handle in a visualization tool.
Forecast Logic
We’re not going to get into the logic here. We have plenty of resources on our website to help you with that. Our Retail Primer devotes an entire chapter to it, and it’s free until July 2023. The point I’m trying to make is that just getting the data collected and organized is not easy. There are many more little issues like the one’s I’ve brought up here that make it hard for your internal team to solve. If you need outside expertise and best practices, we’re here to help!
Comments are closed