
ndBy Jim Lewis, CEO Enhanced Retail Solutions LLC
Generally, we focus on how much inventory we have. But a more important question might be where is our inventory? Many retailers are still woefully imbalanced across their chain in certain product categories. From a high level, everything may look okay, but when you get down to individual products, colors or sizes, it’s a completely different story. Put simply, inventory is balanced when ownership is in the same ratio as sales. If we own 25% of the inventory in blue, we want 25% of our sales to be in blue.
Imbalance happens for many reasons, including poor initial allocation, dated replenishment systems, inconsistent or change in demand, poor presentation and more. Imbalance is a double whammy- too much inventory in non-selling stores ties up capital while not enough in top selling stores leaves money on the table and disappoints customers.
Calculating Lost Sales
In an environment where every sale counts, it is important to know where you are out of stock. This is true for both physical and e-commerce channels. However, calculating lost sales for physical stores is far easier. You can generate the rate of sale (average weekly sales) when you are in stock. Then you can apply that rate of sale for each week you are out of stock. This concept works for both replenishment and fashion items, assuming you are still in an active selling season.
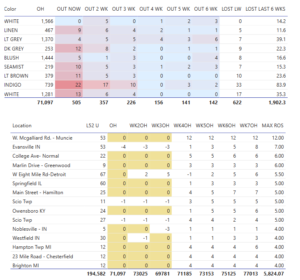
Inventory tracking by store and lost sales calculator
Calculating lost sales is useful on many fronts. It highlights items and stores that may continually be out of stock- and require model adjustments. It helps define volume thresholds a shows the inefficiency in volume group planning. Even if a specific store location is designated as an “A” store, it could be a “C” store for a particular department, sub class or product and vice versa. You cannot afford to have inventory in the wrong stores right now. It is a direct drain on capital.
For e-commerce, assuming you have separate inventory locations like distribution centers, you can apply the same logic as above. But you can also measure how many clicks you got on an item that is out of stock to see if demand is continuing even though it is out of stock. If e-commerce orders are fulfilled by physical stores, lost sales are harder to calculate. The bottom line is you want to quantify what you are potentially leaving on the table so you can improve your demand plan going forward.
Drop Ship
For wholesalers, drop ship inventory should be monitored closely. Providing additional sku’s for selling on multiple online marketplaces is a great way to build sales, but more risk in inventory investment may be required. Track these programs separately, as rate of sale can be much more inconsistent than in physical stores.
Inventory Glut
It is also important to know how much inventory is tied up in non-performing locations. We will want to adjust allocation going forward. Perhaps a product just does not sell in certain stores, presentation is not good, or the item is sitting in a stock room and is not even available to be sold. Whatever the reason, getting inventory out of those stores is imperative. Unfortunately, that can be costly. We tend to think about price reduction as the main motivator, but there could be other options.

Store level allocation tool with built in intelligence
Fixing Inventory Imbalance Across The Chain
If there were no associated costs with transferring inventory between locations, that would be the smartest approach to balance inventory. But unless your stores are located within close proximity of each other, or the value of the inventory itself makes it worthwhile (jewelry), it’s not a viable option.
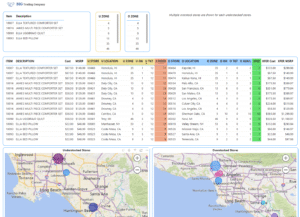
Store to store transfer calculator within zones or specified proximity
There are some great tools to help you monitor the ratio between ownership and selling, calculate lost sales calculators and track inventory by store. Whichever way you do it, make sure it is part of your weekly planning discipline. The investment in time and resources is well worth it.
Comments are closed