
The Importance of Tracking Stock Outs
By Jim Lewis, CEO Enhanced Retail Solutions LLC
I really enjoy tracking sales this time of year. Besides all the numbers getting larger, there’s always an item or two that does far greater than anyone expected. So far, at least with the clients we track, there have been several. Particularly anything new, which makes sense because consumers are hungry for all the goods that are slowly starting to come out of those containers in Los Angeles.
For items that are going to continue, you’re really going to need to know whether the sales base includes lost opportunity. So many forecasts leave money on the table because they are based on history that is not “qualified”. What I mean is that the inventory level in each location must have been sufficient to support the sales potential. For example, maybe a store sold out in 2 weeks, but there are 6 weeks left in the season. What inventory level should each store have been set with to fulfill all 6 weeks?
Drilling Down to Store Level
Drilling down to store level provides the information you need to determine the level of lost sales. The first thing you must consider is what level of inventory represents a stock out. Generally, it is 0, however there are cases where it can be greater. For example, if every store uses 1 unit as a display, then an out of stock is anything below 2 units. For a table presentation, having 1 or 2 units may not meet presentation standards.
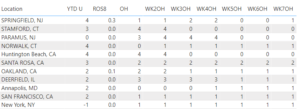
Shows the history of on hand by store
Studying every SKU at store level is not for the faint at heart. Especially with door counts in the thousands. Just getting the POS data can be a challenge but organizing it to make it useful is even more daunting. You can attempt it in a spreadsheet but it’s very manual and depending on the number of sku’s and store count it run slow. Using a BI tool is more helpful. If you want to save yourself some aggravation all together, let ERS help.
How To Do the Analysis
Here are the steps to do the analysis:
- Determine the rate of sale (ROS) when that store was in stock. Basically, come up with the average units sold over the period when OH > X.
- Multiple the ROS by the number of times the store was out of stock. That’s the lost sales.
- Sum all the lost sales and add them back into the ROS.
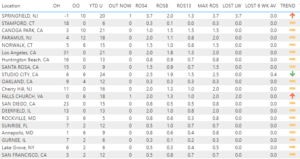
Shows the rate of sale for different time periods and the associated lost sales.
Other Benefits
- Determining the high velocity stores by item type. You can then prioritize them in replenishment scenarios to ensure you get the most bang for your buck.
- On new programs, manage risk by balancing the models by store based on what they earn (not just a 1 or 2 case packs per store).
- Learning when the peak sales occur and flowing product appropriately to ensure it is there at the right time.
Our Retail Primer offers several examples and templates that show the power of this kind of analysis. To learn how ERS can help contact us.
Comments are closed