
The Comparison Game
By Jim Lewis, CEO Enhanced Retail Solutions LLC
During the holiday season, the conversations of how business will be this year versus last year are plentiful. One camp says compare this year to 2019. Another camp says forget the past and just compare to your plan. Whatever stick you decide to use, the takeaway is that you learn by comparing.
At ERS we supply many of our clients with a weekly staple of POS reports to help them get a grasp on their business. For suppliers, we do this for each of their retail accounts. Then one rollup of the top 25 or 50 items across all accounts. There are 3 key reports that provide this information at different levels:
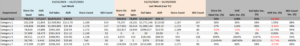
- TY vs. LY: Last week vs. the same week last year, month to date this year vs. same month to date last year and year-to-date this year vs. year-to-date last year. By Dept, Brand, Program. You can also add color and breakdown by channel if those are important to your business. Sales units and dollars, average unit retail, store count and SKU count. Simple, but enough to understand and talk intelligently to the buyer.
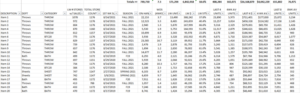
- Multi Week Tracker: Shows the last 4 weeks, unit and dollar sales, the current week on hand and sell through. By Dept, Brand, Program. This is very important in terms of how to flow your inventory to ensure you have enough to meet peak needs, and not sit on inventory during lulls.
![]()
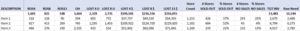
- Filtered Performance: Item level report that shows last week, last 4 weeks, last 8 weeks and year to date. Sales units and dollars, average selling price, store count, sell through. Attributes are important for this report because that’s what enables quick review- category, brand, program, color, size, status, etc. I also include subtotals at the top that change as you filter the report. If the SKU count is high (over 1,000 items) I create a tab for each department or category. Sort by sell through or units sold to see what’s driving the business (and not). Highlight top and bottom sellers.
- Bonus Report: Lost sales: If you have access to store level data it can be eye opening. Reviewing store level rate of sale and counting stock outs help determine true potential. It’s imperative that history be adjusted if it used as the basis for predicting future sales. Also helps with allocating more efficiently and driving sales to the top tier stores.
Even though it’s fun slicing and dicing data, don’t lose sight of the reason for reports in the first place- to take action. A key benefit of data is removing emotion from decision making (at least as it relates to planning). The reports listed here are a great start. Documenting and fixing opportunities and liabilities at store level reduces risk, increases sales, and reduces markdowns. After all, isn’t that really the goal of virtually every supplier and retailer?
If you need help acquiring, translating and making use of POS data, contact ERS here.
JotForm.newDefaultTheme = false;
JotForm.extendsNewTheme = true;
JotForm.singleProduct = false;
JotForm.newPaymentUIForNewCreatedForms = false;
JotForm.newPaymentUI = true;
JotForm.highlightInputs = false;
JotForm.init(function(){
/*INIT-START*/
if (window.JotForm && JotForm.accessible) $('input_1').setAttribute('tabindex',0);
if (window.JotForm && JotForm.accessible) $('input_3').setAttribute('tabindex',0);
JotForm.setPhoneMaskingValidator( 'input_12_full', '(###) ###-####' );
if (window.JotForm && JotForm.accessible) $('input_4').setAttribute('tabindex',0);
JotForm.setCustomHint( 'input_4', 'Type here...' );
JotForm.alterTexts({"confirmClearForm":"Are you sure you want to clear the form","incompleteFields":"Please complete required (*) fields.","lessThan":"Your score should be less than"});
/*INIT-END*/
});
JotForm.prepareCalculationsOnTheFly([null,{"description":"","name":"name1","qid":"1","subLabel":"","text":"Name","type":"control_textbox"},null,{"description":"","name":"email","qid":"3","subLabel":"","text":"E-mail","type":"control_textbox"},{"description":"","name":"howMay","qid":"4","subLabel":"","text":"How may we help you?","type":"control_textarea"},null,null,{"name":"submit7","qid":"7","text":"Submit","type":"control_button"},null,null,null,null,{"description":"","name":"phoneNumber","qid":"12","text":"Phone Number","type":"control_phone"}]);
setTimeout(function() {
JotForm.paymentExtrasOnTheFly([null,{"description":"","name":"name1","qid":"1","subLabel":"","text":"Name","type":"control_textbox"},null,{"description":"","name":"email","qid":"3","subLabel":"","text":"E-mail","type":"control_textbox"},{"description":"","name":"howMay","qid":"4","subLabel":"","text":"How may we help you?","type":"control_textarea"},null,null,{"name":"submit7","qid":"7","text":"Submit","type":"control_button"},null,null,null,null,{"description":"","name":"phoneNumber","qid":"12","text":"Phone Number","type":"control_phone"}]);}, 20);
@media print{.form-section{display:inline!important}.form-pagebreak{display:none!important}.form-section-closed{height:auto!important}.page-section{position:initial!important}}
/* Injected CSS Code */
/*PREFERENCES STYLE*/
/* NEW THEME STYLE */
/* colors */
.form-textbox, .form-textarea {
color: undefined;
}
.rating-item input:hover+label {
color: #2e69ff;
}
li[data-type=control_fileupload] .qq-upload-button,
.until-text,
.form-submit-reset {
color: #2c3345;
}
.stageEmpty.isSmall{
color: #CAD0CF;
}
.rating-item label {
color: #b8bdc9;
}
.currentDate,
.pickerItem select,
.appointmentCalendar .calendarDay,
.calendar.popup th,
.calendar.popup table tbody td,
.calendar-new-header>*,
.form-collapse-table {
color: #2C3345;
}
.appointmentCalendar .dayOfWeek {
color: #2e69ff;
}
.appointmentSlotsContainer > * {
color: #2e69ff;
}
li[data-type=control_fileupload] .jfUpload-heading,
::placeholder,
.form-dropdown.is-active,
.form-dropdown:first-child,
.form-spinner-input {
color: #57647e;
}
.appointmentCalendar .calendarWeek .calendarDay.isUnavailable,
.calendar tr.days td.otherDay,
.calendar tr.days td:hover:not(.unselectable) {
color: #CAD0CF;
}
span.form-sub-label, label.form-sub-label, div.form-header-group .form-subHeader,
.rating-item-title.for-to > label:first-child,
.rating-item-title.for-from > label:first-child,
.rating-item-title .editor-container * {
color: #57647E;
}
.form-pagebreak-back{
color: #2c3345;
}
.rating-item input:checked+label,
.rating-item input:focus+label {
color: #FFFFFF;
}
.clear-pad-btn {
color: #57647e;
}
.form-textbox::placeholder,
.form-dropdown:not(.time-dropdown):not(:required),
.form-dropdown:not(:required),
.form-dropdown:required:invalid {
color: #57647e;
}
/* border-colors */
.form-dropdown,
.form-textarea,
.form-textbox,
li[data-type=control_fileupload] .qq-upload-button,
.rating-item label,
.rating-item input:focus+label,
.rating-item input:checked+label,
.jf-form-buttons,
.form-checkbox+label:before, .form-checkbox+span:before, .form-radio+label:before, .form-radio+span:before,
.signature-pad-passive,
.signature-wrapper,
.appointmentCalendarContainer,
.appointmentField .timezonePickerName,
.appointmentDayPickerButton,
.appointmentCalendarContainer .monthYearPicker .pickerItem+.pickerItem,
.appointmentCalendarContainer .monthYearPicker,
.appointmentCalendar .calendarDay.isActive .calendarDayEach, .appointmentCalendar .calendarDay.isToday .calendarDayEach, .appointmentCalendar .calendarDay:not(.empty):hover .calendarDayEach,
.calendar.popup:before,
.calendar-new-month,
.form-matrix-column-headers, .form-matrix-table td, .form-matrix-table td:last-child,
.form-matrix-table th, .form-matrix-table th:last-child, .form-matrix-table tr:last-child td, .form-matrix-table tr:last-child th, .form-matrix-table tr:not([role=group])+tr[role=group] th,
.form-matrix-headers.form-matrix-column-headers,
.isSelected .form-matrix-column-headers:nth-last-of-type(2),
li[data-type=control_inline] input[type=email], li[data-type=control_inline] input[type=number],
li[data-type=control_inline] input[type=tel], li[data-type=control_inline] input[type=text],
.stageEmpty.isSmall {
border-color: #b8bdc9;
}
.rating-item input:hover+label {
border-color: #2e69ff;
}
.appointmentSlot,
.form-checkbox:checked+label:before, .form-checkbox:checked+span:before, .form-checkbox:checked+span label:before,
.form-radio:checked+label:before, .form-radio:checked+span:before,
.form-dropdown:focus, .form-textarea:focus, .form-textbox:focus, .signature-wrapper:focus,
.form-line[data-payment="true"] .form-product-item .p_checkbox .checked,
.form-dropdown:hover, .form-textarea:hover, .form-textbox:hover, .signature-wrapper:hover {
border-color: #2e69ff;
}
.calendar tr.days td:hover:not(.unselectable):after {
border-color: #e5eaf4;
}
.form-header-group,
.form-buttons-wrapper, .form-pagebreak, .form-submit-clear-wrapper,
.form-pagebreak-next,
.form-pagebreak-back,
.form-checkbox:hover+label:before, .form-checkbox:hover+span:before, .form-radio:hover+label:before, .form-radio:hover+span:before,
.divider {
border-color: #F3F3FE;
}
.form-pagebreak-back:focus, .form-pagebreak-next:focus, .form-submit-button:focus {
border-color: rgba(46, 105, 255, 1);
}
/* background-colors */
.form-line-active {
background-color: #F1F5FF;
}
.form-line-error {
background-color: #FFD6D6;
}
.form-matrix-column-headers, .form-matrix-row-headers,
.form-spinner-button-container>*,
.form-collapse-table,
.form-collapse-table:hover,
.appointmentDayPickerButton {
background-color: #e5eaf4;
}
.calendar.popup, .calendar.popup table,
.calendar.popup table tbody td:after{
background-color: #FFFFFF;
}
.appointmentCalendar .calendarDay.isActive .calendarDayEach,
.appointmentFieldRow.forSelectedDate,
.calendar.popup tr.days td.selected:after,
.calendar.popup:after,
.submit-button,
.form-checkbox:checked+label:before, .form-checkbox:checked+span:before, .form-checkbox:checked+span label:before,
.form-radio+label:after, .form-radio+span:after,
.rating-item input:checked+label,
.appointmentCalendar .calendarDay:after,
.form-line[data-payment="true"] .form-product-item .p_checkbox .checked,
.rating-item input:focus+label {
background-color: #2e69ff;
}
.appointmentSlot.active {
background-color: #2e69ff !important;
}
.clear-pad-btn,
.appointmentCalendar .dayOfWeek,
.calendar.popup th {
background-color: #eef3ff !important;
}
.appointmentField .timezonePicker:hover+.timezonePickerName,
.form-spinner-button-container>*:hover {
background-color: #eef3ff;
}
.form-matrix-values,
.form-matrix-values,
.signature-wrapper,
.signature-pad-passive,
.rating-item label,
.form-checkbox+label:before, .form-checkbox+span:before,
.form-radio+label:before, .form-radio+span:before {
background-color: #FFFFFF;
}
li[data-type=control_fileupload] .qq-upload-button {
background-color: #fbfcff;
}
.JotFormBuilder .appContainer #app li.form-line[data-type=control_matrix].isSelected
.questionLine-editButton.forRemove:after,
.JotFormBuilder .appContainer #app li.form-line[data-type=control_matrix].isSelected .questionLine-editButton.forRemove:before {
background-color: #FFFFFF;
}
.appointmentCalendarContainer, .appointmentSlot,
.rating-item-title.for-to > label:first-child,
.rating-item-title.for-from > label:first-child,
.rating-item-title .editor-container *,
.calendar-opened {
background-color: transparent;
}
.page-section li.form-line-active[data-type="control_button"] {
background-color: #F1F5FF;
}
.appointmentCalendar .calendarDay.isSelected:after {
color: #FFFFFF;
}
/* shadow */
.form-dropdown:hover, .form-textarea:hover, .form-textbox:hover, .signature-wrapper:hover,
.calendar.popup:before,
.jSignature:hover,
li[data-type=control_fileupload] .qq-upload-button-hover,
.form-line[data-payment="true"] .form-product-item .p_checkbox .checked,
.form-line[data-payment="true"] .form-product-item .p_checkbox:hover .select_border,
.form-checkbox:hover+label:before, .form-checkbox:hover+span:before, .form-radio:hover+label:before, .form-radio:hover+span:before,
.calendar.popup:before {
border-color: rgba(46, 105, 255, 0.5);
box-shadow: 0 0 0 2px rgba(46, 105, 255, 0.25);
}
.form-dropdown:focus, .form-textarea:focus, .form-textbox:focus, .signature-wrapper:focus,
li[data-type=control_fileupload] .qq-upload-button-focus,
.form-checkbox:focus+label:before, .form-checkbox:focus+span:before, .form-radio:focus+label:before, .form-radio:focus+span:before,
.calendar.popup:before {
border-color: rgba(46, 105, 255, 1);
box-shadow: 0 0 0 3px rgba(46, 105, 255, 0.25);
}
.calendar.popup table tbody td{
box-shadow: none;
}
/* button colors */
.submit-button {
background-color: #18BD5B;
border-color: #18BD5B;
}
.submit-button:hover {
background-color: #16AA52;
border-color: #16AA52;
}
.form-pagebreak-next {
background-color: #2e69ff;
}
.form-pagebreak-back {
background-color: #e5e7f2;
}
.form-pagebreak-back:hover {
background-color: #CED0DA;
border-color: #CED0DA;
}
.form-pagebreak-next:hover {
background-color: #2554CC;
border-color: #2554CC;
}
.form-sacl-button, .form-submit-print {
background-color: transparent;
color: #2c3345;
border-color: #b8bdc9;
}
.form-sacl-button:hover, .form-submit-print:hover,
.appointmentSlot:not(.disabled):not(.active):hover,
.appointmentDayPickerButton:hover,
.rating-item input:hover+label {
background-color: #96B4FF;
}
/* payment styles */
.form-line[data-payment=true] .form-textbox,
.form-line[data-payment=true] .select-area,
.form-line[data-payment=true] #coupon-input,
.form-line[data-payment=true] #coupon-container input,
.form-line[data-payment=true] input#productSearch-input,
.form-line[data-payment=true] .form-product-category-item:after,
.form-line[data-payment=true] .filter-container .dropdown-container .select-content,
.form-line[data-payment=true] .form-textbox.form-product-custom_quantity,
.form-line[data-payment="true"] .form-product-item .p_checkbox .select_border,
.form-line[data-payment="true"] .form-product-item .form-product-container .form-sub-label-container span.select_cont,
.form-line[data-payment=true] select.form-dropdown,
.form-line[data-payment=true] #payment-category-dropdown .select-area,
.form-line[data-payment=true] #payment-sorting-products-dropdown .select-area,
.form-line[data-payment=true] .dropdown-container .select-content {
border-color: #b8bdc9;
border-color: undefined;
}
.form-line[data-payment="true"] hr,
.form-line[data-payment=true] .p_item_separator,
.form-line[data-payment="true"] .payment_footer.new_ui,
.form-line.card-3col .form-product-item.new_ui,
.form-line.card-2col .form-product-item.new_ui {
border-color: #b8bdc9;
border-color: undefined;
}
.form-line[data-payment=true] .form-product-category-item {
border-color: #b8bdc9;
border-color: undefined;
}
.form-line[data-payment=true] #coupon-input,
.form-line[data-payment=true] .form-textbox.form-product-custom_quantity,
.form-line[data-payment=true] input#productSearch-input,
.form-line[data-payment=true] .select-area,
.form-line[data-payment=true] .custom_quantity,
.form-line[data-payment=true] .filter-container .select-content,
.form-line[data-payment=true] .p_checkbox .select_border,
.form-line[data-payment=true] #payment-category-dropdown .select-area,
.form-line[data-payment=true] #payment-sorting-products-dropdown .select-area,
.form-line[data-payment=true] .dropdown-container .select-content {
background-color: #FFFFFF;
}
.form-line[data-payment=true] .form-product-category-item.title_collapsed.has_selected_product .selected-items-icon {
background-color: undefined;
border-color: undefined;
}
.form-line[data-payment=true].form-line.card-3col .form-product-item,
.form-line[data-payment=true].form-line.card-2col .form-product-item {
background-color: undefined;
}
.form-line[data-payment=true] .payment-form-table input.form-textbox,
.form-line[data-payment=true] .payment-form-table input.form-dropdown,
.form-line[data-payment=true] .payment-form-table .form-sub-label-container > div,
.form-line[data-payment=true] .payment-form-table span.form-sub-label-container iframe,
.form-line[data-type=control_square] .payment-form-table span.form-sub-label-container iframe {
border-color: #b8bdc9;
}
/* icons */
.appointmentField .timezonePickerName:before {
background-image: url(data:image/svg+xml;base64,PHN2ZyB3aWR0aD0iMTYiIGhlaWdodD0iMTYiIHZpZXdCb3g9IjAgMCAxNiAxNiIgZmlsbD0ibm9uZSIgeG1sbnM9Imh0dHA6Ly93d3cudzMub3JnLzIwMDAvc3ZnIj4KPHBhdGggZmlsbC1ydWxlPSJldmVub2RkIiBjbGlwLXJ1bGU9ImV2ZW5vZGQiIGQ9Ik0wIDcuOTYwMkMwIDMuNTY2MTcgMy41NTgyMSAwIDcuOTUyMjQgMEMxMi4zNTQyIDAgMTUuOTIwNCAzLjU2NjE3IDE1LjkyMDQgNy45NjAyQzE1LjkyMDQgMTIuMzU0MiAxMi4zNTQyIDE1LjkyMDQgNy45NTIyNCAxNS45MjA0QzMuNTU4MjEgMTUuOTIwNCAwIDEyLjM1NDIgMCA3Ljk2MDJaTTEuNTkzNzUgNy45NjAyQzEuNTkzNzUgMTEuNDc4NiA0LjQ0MzUgMTQuMzI4NCA3Ljk2MTkxIDE0LjMyODRDMTEuNDgwMyAxNC4zMjg0IDE0LjMzMDEgMTEuNDc4NiAxNC4zMzAxIDcuOTYwMkMxNC4zMzAxIDQuNDQxNzkgMTEuNDgwMyAxLjU5MjA0IDcuOTYxOTEgMS41OTIwNEM0LjQ0MzUgMS41OTIwNCAxLjU5Mzc1IDQuNDQxNzkgMS41OTM3NSA3Ljk2MDJaIiBmaWxsPSIjMTExMTExIi8+CjxwYXRoIGQ9Ik04LjM1ODA5IDMuOTgwNDdINy4xNjQwNlY4Ljc1NjU5TDExLjM0MzIgMTEuMjY0MUwxMS45NDAyIDEwLjI4NDlMOC4zNTgwOSA4LjE1OTU3VjMuOTgwNDdaIiBmaWxsPSIjMTExMTExIi8+Cjwvc3ZnPgo=);
}
.appointmentCalendarContainer .monthYearPicker .pickerArrow.prev:after {
background-image: url(data:image/svg+xml;base64,PHN2ZyB3aWR0aD0iMTAiIGhlaWdodD0iNiIgdmlld0JveD0iMCAwIDEwIDYiIGZpbGw9Im5vbmUiIHhtbG5zPSJodHRwOi8vd3d3LnczLm9yZy8yMDAwL3N2ZyI+CjxwYXRoIGQ9Ik04LjU5NzgyIDUuMzMyNzNDOC45MzMxMiA1LjYzNjI3IDkuNDM5MzkgNS42Mjk2OSA5Ljc1NjEzIDUuMzEyNzhDMTAuMDgxMyA0Ljk4NzQ1IDEwLjA4MTMgNC40NTk2MyA5Ljc1NjEzIDQuMTM0M0M5LjYwOTA0IDMuOTk2MzUgOS42MDkwMyAzLjk5NjM1IDkuMDg5NDkgMy41MTExOEM4LjQzNzQyIDIuOTAyMTggOC40Mzc0MyAyLjkwMjE4IDcuNjU1MTEgMi4xNzE1NkM2LjA4OTU2IDAuNzA5NDQ3IDYuMDg5NTYgMC43MDk0NDYgNS41Njc3MyAwLjIyMjEwMUM1LjI0MTA0IC0wLjA3NDUwNjcgNC43NTA4NSAtMC4wNzM1MDMgNC40MzIzNSAwLjIyMTkyOUwwLjI2MjU0IDQuMTE0MjRDLTAuMDgwNTQ1OSA0LjQ1NTQ1IC0wLjA4NzE3MTEgNC45ODM5NyAwLjI0MTQ2OCA1LjMxMjc4QzAuNTU5NTU4IDUuNjMxMDUgMS4wNjk3NSA1LjYzNjY4IDEuMzk3MDMgNS4zMzI2Mkw0Ljk5ODkxIDEuOTcxMzFMOC41OTc4MiA1LjMzMjczWiIgZmlsbD0iI0NGQ0ZDRiIvPgo8L3N2Zz4K);
}
.appointmentCalendarContainer .monthYearPicker .pickerArrow.next:after {
background-image: url(data:image/svg+xml;base64,PHN2ZyB3aWR0aD0iMTAiIGhlaWdodD0iNiIgdmlld0JveD0iMCAwIDEwIDYiIGZpbGw9Im5vbmUiIHhtbG5zPSJodHRwOi8vd3d3LnczLm9yZy8yMDAwL3N2ZyI+CjxwYXRoIGQ9Ik0xLjQwMjE4IDAuMjIzNDk3QzEuMDY2ODcgLTAuMDgwMTAyOCAwLjU2MDYwMiAtMC4wNzM1MDI4IDAuMjQzODY5IDAuMjQzMzk3Qy0wLjA4MTI4OTggMC41Njg2OTcgLTAuMDgxMjg5OCAxLjA5NjYgMC4yNDM4NjkgMS40MjE5QzAuMzkwOTU2IDEuNTU5OCAwLjM5MDk2NiAxLjU1OTggMC45MTA1MSAyLjA0NUMxLjU2MjU3IDIuNjU0IDEuNTYyNTYgMi42NTQgMi4zNDQ4OCAzLjM4NDZDMy45MTA0NCA0Ljg0NjcgMy45MTA0MyA0Ljg0NjcgNC40MzIyNyA1LjMzNDFDNC43NTg5NSA1LjYzMDcgNS4yNDkxNSA1LjYyOTcgNS41Njc2NCA1LjMzNDNMOS43Mzc0NiAxLjQ0MkMxMC4wODA1IDEuMTAwNyAxMC4wODcxIDAuNTcyMTk3IDkuNzU4NTMgMC4yNDMzOTdDOS40NDA0NCAtMC4wNzQ5MDI4IDguOTMwMjQgLTAuMDgwNTAyOCA4LjYwMjk3IDAuMjIzNTk3TDUuMDAxMDggMy41ODQ5TDEuNDAyMTggMC4yMjM0OTdaIiBmaWxsPSIjQ0ZDRkNGIi8+Cjwvc3ZnPgo=);
}
.appointmentField .timezonePickerName:after {
background-image: url(data:image/svg+xml;base64,PHN2ZyB3aWR0aD0iMTAiIGhlaWdodD0iNiIgdmlld0JveD0iMCAwIDEwIDYiIGZpbGw9Im5vbmUiIHhtbG5zPSJodHRwOi8vd3d3LnczLm9yZy8yMDAwL3N2ZyI+CjxwYXRoIGQ9Ik0wLjA1Mjk5IDAuMjM2NTcyQzAuMDExMzU0NiAwLjMwNzc4NSAtMC4wMDYzMDI4MiAwLjM4NzUzNCAwLjAwMTk5OTIzIDAuNDY2ODdDMC4wMTAzMDEzIDAuNTQ2MjA2IDAuMDQ0MjM0MyAwLjYyMTk4OSAwLjA5OTk5MDEgMC42ODU3MTVMNC41OTk5OSA1LjgyODU3QzQuNjQ2NTcgNS44ODE4IDQuNzA2OTYgNS45MjUgNC43NzYzOSA1Ljk1NDc1QzQuODQ1ODIgNS45ODQ1MSA0LjkyMjM3IDYgNC45OTk5OSA2QzUuMDc3NjIgNiA1LjE1NDE3IDUuOTg0NTEgNS4yMjM2IDUuOTU0NzVDNS4yOTMwMyA1LjkyNSA1LjM1MzQyIDUuODgxOCA1LjQgNS44Mjg1N0w5LjkgMC42ODU3MTRDOS45NjQ5MSAwLjYxMTUzIDEwIDAuNTIxMzAxIDEwIDAuNDI4NTcxQzkuOTk5NzEgMC4zNjE5MzggOS45ODE1NyAwLjI5NjI1MiA5Ljk0NyAwLjIzNjU3MUM5LjkwNTQzIDAuMTY1NDc0IDkuODQxNjEgMC4xMDU2OTEgOS43NjI2NyAwLjA2MzkxMTVDOS42ODM3MyAwLjAyMjEzMTcgOS41OTI3OCAyLjYwNjg5ZS0wNiA5LjUgLTUuNzYzMDNlLTA4TDAuNDk5OTkgMy4zNTc3M2UtMDdDMC40MDcyMTIgMy4wMDg0ZS0wNiAwLjMxNjI2NCAwLjAyMjEzMjEgMC4yMzczMjEgMC4wNjM5MTE5QzAuMTU4Mzc5IDAuMTA1NjkyIDAuMDk0NTU0NyAwLjE2NTQ3NCAwLjA1Mjk5IDAuMjM2NTcyVjAuMjM2NTcyWiIgZmlsbD0iIzExMTExMSIvPgo8L3N2Zz4K);
width: 11px;
}
li[data-type=control_datetime] [data-wrapper-react=true].extended>div+.form-sub-label-container .form-textbox:placeholder-shown,
li[data-type=control_datetime] [data-wrapper-react=true]:not(.extended) .form-textbox:not(.time-dropdown):placeholder-shown,
.appointmentCalendarContainer .currentDate {
background-image: url(data:image/svg+xml;base64,PHN2ZyB3aWR0aD0iMTciIGhlaWdodD0iMTYiIHZpZXdCb3g9IjAgMCAxNyAxNiIgZmlsbD0ibm9uZSIgeG1sbnM9Imh0dHA6Ly93d3cudzMub3JnLzIwMDAvc3ZnIj4KPHBhdGggZD0iTTE1Ljk0ODkgNVYxNS4wMjZDMTUuOTQ4OSAxNS41NjM5IDE1LjUwMjYgMTYgMTQuOTUyMSAxNkgwLjk5NjgwNUMwLjQ0NjI4NSAxNiAwIDE1LjU2MzkgMCAxNS4wMjZWNUgxNS45NDg5Wk00LjE5MjQ1IDExLjQxNjdIMi4zNzQ3NEwyLjI4NTE1IDExLjQyNDdDMi4xMTA3OCAxMS40NTY1IDEuOTY4MDEgMTEuNTc5MiAxLjkwNzUyIDExLjc0MjJMMS44ODQzNyAxMS44MjY4TDEuODc2MzQgMTEuOTE2N1YxMy42NjY3TDEuODg0MzcgMTMuNzU2NUMxLjkxNjAyIDEzLjkzMTUgMi4wMzg0IDE0LjA3NDcgMi4yMDA4MyAxNC4xMzU0TDIuMjg1MTUgMTQuMTU4NkwyLjM3NDc0IDE0LjE2NjdINC4xOTI0NUw0LjI4MjAzIDE0LjE1ODZDNC40NTY0MSAxNC4xMjY5IDQuNTk5MTggMTQuMDA0MSA0LjY1OTY3IDEzLjg0MTFMNC42ODI4MiAxMy43NTY1TDQuNjkwODUgMTMuNjY2N1YxMS45MTY3TDQuNjgyODIgMTEuODI2OEM0LjY1MTE3IDExLjY1MTkgNC41Mjg3OSAxMS41MDg2IDQuMzY2MzUgMTEuNDQ3OUw0LjI4MjAzIDExLjQyNDdMNC4xOTI0NSAxMS40MTY3Wk04Ljg4MzI5IDExLjQxNjdINy4wNjU1OUw2Ljk3NiAxMS40MjQ3QzYuODAxNjIgMTEuNDU2NSA2LjY1ODg1IDExLjU3OTIgNi41OTgzNyAxMS43NDIyTDYuNTc1MjIgMTEuODI2OEw2LjU2NzE5IDExLjkxNjdWMTMuNjY2N0w2LjU3NTIyIDEzLjc1NjVDNi42MDY4NyAxMy45MzE1IDYuNzI5MjUgMTQuMDc0NyA2Ljg5MTY4IDE0LjEzNTRMNi45NzYgMTQuMTU4Nkw3LjA2NTU5IDE0LjE2NjdIOC44ODMyOUw4Ljk3Mjg4IDE0LjE1ODZDOS4xNDcyNiAxNC4xMjY5IDkuMjkwMDMgMTQuMDA0MSA5LjM1MDUxIDEzLjg0MTFMOS4zNzM2NyAxMy43NTY1TDkuMzgxNyAxMy42NjY3VjExLjkxNjdMOS4zNzM2NyAxMS44MjY4QzkuMzQyMDIgMTEuNjUxOSA5LjIxOTY0IDExLjUwODYgOS4wNTcyIDExLjQ0NzlMOC45NzI4OCAxMS40MjQ3TDguODgzMjkgMTEuNDE2N1pNNC4xOTI0NSA2LjgzMzMzSDIuMzc0NzRMMi4yODUxNSA2Ljg0MTM5QzIuMTEwNzggNi44NzMxNCAxLjk2ODAxIDYuOTk1OTEgMS45MDc1MiA3LjE1ODg3TDEuODg0MzcgNy4yNDM0NkwxLjg3NjM0IDcuMzMzMzNWOS4wODMzM0wxLjg4NDM3IDkuMTczMjFDMS45MTYwMiA5LjM0ODE1IDIuMDM4NCA5LjQ5MTM3IDIuMjAwODMgOS41NTIwNUwyLjI4NTE1IDkuNTc1MjhMMi4zNzQ3NCA5LjU4MzMzSDQuMTkyNDVMNC4yODIwMyA5LjU3NTI4QzQuNDU2NDEgOS41NDM1MyA0LjU5OTE4IDkuNDIwNzUgNC42NTk2NyA5LjI1NzhMNC42ODI4MiA5LjE3MzIxTDQuNjkwODUgOS4wODMzM1Y3LjMzMzMzTDQuNjgyODIgNy4yNDM0NkM0LjY1MTE3IDcuMDY4NTIgNC41Mjg3OSA2LjkyNTI5IDQuMzY2MzUgNi44NjQ2MUw0LjI4MjAzIDYuODQxMzlMNC4xOTI0NSA2LjgzMzMzWk04Ljg4MzI5IDYuODMzMzNINy4wNjU1OUw2Ljk3NiA2Ljg0MTM5QzYuODAxNjIgNi44NzMxNCA2LjY1ODg1IDYuOTk1OTEgNi41OTgzNyA3LjE1ODg3TDYuNTc1MjIgNy4yNDM0Nkw2LjU2NzE5IDcuMzMzMzNWOS4wODMzM0w2LjU3NTIyIDkuMTczMjFDNi42MDY4NyA5LjM0ODE1IDYuNzI5MjUgOS40OTEzNyA2Ljg5MTY4IDkuNTUyMDVMNi45NzYgOS41NzUyOEw3LjA2NTU5IDkuNTgzMzNIOC44ODMyOUw4Ljk3Mjg4IDkuNTc1MjhDOS4xNDcyNiA5LjU0MzUzIDkuMjkwMDMgOS40MjA3NSA5LjM1MDUxIDkuMjU3OEw5LjM3MzY3IDkuMTczMjFMOS4zODE3IDkuMDgzMzNWNy4zMzMzM0w5LjM3MzY3IDcuMjQzNDZDOS4zNDIwMiA3LjA2ODUyIDkuMjE5NjQgNi45MjUyOSA5LjA1NzIgNi44NjQ2MUw4Ljk3Mjg4IDYuODQxMzlMOC44ODMyOSA2LjgzMzMzWk0xMy41NzQxIDYuODMzMzNIMTEuNzU2NEwxMS42NjY4IDYuODQxMzlDMTEuNDkyNSA2Ljg3MzE0IDExLjM0OTcgNi45OTU5MSAxMS4yODkyIDcuMTU4ODdMMTEuMjY2MSA3LjI0MzQ2TDExLjI1OCA3LjMzMzMzVjkuMDgzMzNMMTEuMjY2MSA5LjE3MzIxQzExLjI5NzcgOS4zNDgxNSAxMS40MjAxIDkuNDkxMzcgMTEuNTgyNSA5LjU1MjA1TDExLjY2NjggOS41NzUyOEwxMS43NTY0IDkuNTgzMzNIMTMuNTc0MUwxMy42NjM3IDkuNTc1MjhDMTMuODM4MSA5LjU0MzUzIDEzLjk4MDkgOS40MjA3NSAxNC4wNDE0IDkuMjU3OEwxNC4wNjQ1IDkuMTczMjFMMTQuMDcyNSA5LjA4MzMzVjcuMzMzMzNMMTQuMDY0NSA3LjI0MzQ2QzE0LjAzMjkgNy4wNjg1MiAxMy45MTA1IDYuOTI1MjkgMTMuNzQ4IDYuODY0NjFMMTMuNjYzNyA2Ljg0MTM5TDEzLjU3NDEgNi44MzMzM1oiIGZpbGw9IiM1ODY1N0MiLz4KPHBhdGggZD0iTTEzLjA1MjIgMS4xMjVIMTUuMDQ1OEMxNS41OTYzIDEuMTI1IDE2LjA0MjYgMS42MDA3IDE2LjA0MjYgMi4xODc1VjRIMC4wOTM3NVYyLjE4NzVDMC4wOTM3NSAxLjYwMDcgMC41NDAwMzUgMS4xMjUgMS4wOTA1NiAxLjEyNUgzLjA4NDE3VjEuMDYyNUMzLjA4NDE3IDAuNDc1Njk3IDMuNTMwNDUgMCA0LjA4MDk3IDBDNC42MzE0OSAwIDUuMDc3NzggMC40NzU2OTcgNS4wNzc3OCAxLjA2MjVWMS4xMjVIMTEuMDU4NlYxLjA2MjVDMTEuMDU4NiAwLjQ3NTY5NyAxMS41MDQ5IDAgMTIuMDU1NCAwQzEyLjYwNTkgMCAxMy4wNTIyIDAuNDc1Njk3IDEzLjA1MjIgMS4wNjI1VjEuMTI1WiIgZmlsbD0iIzU4NjU3QyIvPgo8L3N2Zz4K);
}
.form-star-rating-star.Stars {
background-image: url(data:image/png;base64,iVBORw0KGgoAAAANSUhEUgAAAKAAAAAeCAYAAACrDxUoAAAACXBIWXMAAAsTAAALEwEAmpwYAAAAAXNSR0IArs4c6QAAAARnQU1BAACxjwv8YQUAAAvDSURBVHgB7VtLbBvXFb1vZjgiRdEmlcKWYQWlDLuo0QamC7SRW7sdpg0QO4uiaLsoGsBysq/RbQtEYpCkyMpJurY+aLpogtbdSAaapGTzge1kYW4KJ0g/TGpbNm2JlEiK5Pxe7x1xBIqixuIbkkKbHGDA+b13+O6cOe/NuzMAX+AL/K/i3Q8+Ov/etY8uwC4h/9bo+XtvP/y55b/71uil3Yx/6cTJ86snTvniZyCI9Ic3tKCkpGnd1M3kqRNHM9BHLL45qinqcIN/OXng8ZsZ6CMcfoXaz8A0jf7z/+XghCSxmX/F0rsS/8LJk1pg30ia47p5+04ydvW9DAhAAkEonE3G9kYgFo0AyGwS+gyZwWRo/xmghdahzyDOcGQYwpHYrvBL0jrnrsWfw6T6zNMwgIuf9gsJkNxPkWUtMhSCSDgEtP7ulRsa9AnkPiwwrKmxR4EWWqd90Cc4/LKihUIRoIXJgf7yo/sFQ3vitL4b8Sf3k/aPaIEzp4EWdmBEK4yf1EAAQgJ03c9Fv+9C1/1c9NsFXfdz0W8XJPcjThd9j3/D/Vz4ccGOBdjsfi76eRc2u5+Lfrpgs/u56KcLuu4ny4GNff2Mf7P7ufDjgh0LsNX9XPTrLmx1Pxf9csFW93PRLxdsdT8XfYt/i/u5EHXBjgTYzv1c9OMubOd+Lvrhgu3cz0U/XLCd+7noR/zbuZ8LURfcsQDT169H0f0utHM/F+5dmL5yIw5dxr/T0ajE4EI793PhuuBieiQOPeJv534uXBfsBT/VuZ37uehl/AuaFpVsuNDO/Vy4LlgYH4/DDrFpHpBEBkY4DmAlFGB78WCCry9RmbF4ZGgQHort8axwqbAKK6UKrvEiVp/FOnIW55/aMs+CreQgUMkljx8vtitLFzmM/JYMCZmzvTawBAOeAMajjA3G1eFHYfDAjz351xb/CPX7GWoYcWSxjhwnfmZlA7aUqyD/WLLYOT/I8eBgBCJ7vuTJX169D2uVFd/8YLM4Y+zLxI91xYFJURLfYDi6cX5+8Z9gfv3v0K34k8hA1+O4mlC4tJdLHK89SwBnUWkoHCeXGzj/C/BC/dVXQf/DG7RaxCBk8X9g+xnysyxYVg5UNRfLZDb4HQG+++HHkxikCRKZJEugBgIQUGQ8NwASY84vbXcCw7RwgtbC9hhgWlZj2wTdMJ3g2DZLfW/8qy/TuXffHsWxA58gkTF5EOTQQZDUYZCDoyDJofXtwEOd0INtLIGtL4NVvQVWY93Zrt10xGFznhp5/NZmfhQZQ5sJBFTkDYASGMD2S/irQrtuzwuWZeBigmnUnV+btrH9pql78suy4vDS/6DfgLLOTdutaCdAkfiXvn1yEm+UCRIZRIZAPnwYu9MDIB85AqxpuxPwxUWw79wB65N/gI3r7raN24gi6i2198r7LyvrZ3MNxxDxfQ9FoVsgwdISCqpbjt1bKkZLleoPcdUJAOOgBWLj8fDoU9AtkGBpUcJHthyr3HwtahSubeIfwLHVnug+6BZINLSo6tbx8moxH61XSz3l7yT+HPnVJ5+IB3/9K+gWHAHTcvz4lmO1F16MGvOXHX7ntjItfq5cqWYLKyXoNYgDG58lTnefZZjn9MK1bPXuZeg1asihL1/LEmczf61aylZKBeg1iKO2VmrDX871g79t/DnGf+Fytn5xBnqN+vQMEBdx0rYjwOSJozkzUE0WVso9FSHVTRzERZzu/gOn7+RUWUnW8gs9FSGJr3p3IbtWLieJs5W/Ul7uqQip7kppuS2/bRjIX+ipCLeLf+zq1ZytKsn69HRPRUjiq1+czhIXcdK+LQ8hihFKD4VDiW52xwS0/fU7jxq/3SA4HY/qlpnGKZVEN7tjQuU/vwe9cNW5+GM/KnryB0ORRDe7QwJ2u47z7YQ/PDSc8HradeE1BmzFjuJPT7o6xv/M6UQ3u2NC7YXfoPMtrIuv6SFk08iW/hj9wXK5eim/VIRuodH4tFfjCbFkrkhOpBc+uITjNOgWSHz14tW018Vv5sfu8BIJpluguqrVUman/N124kb8Mw+MPwqDBILjsz/jOA26BRKfMb+QaRUfYdvXsd65dmMGp10m/DihbdvOtMBqeW32u48ePddJ2btvHZxRY+MTfpyQW2uwdvsS6MUrs/t/cKtjfpz0nfDjhBzbX8JpmVp1dQ75J3ZaznXCUDiaiOzZ/un/QQ7YFP85jP8EdICVE9+ZVZ88c9aPE/JyGeqv/Bb0+fk5fOKdaHfOthPRJJgSCsePE4qKj0CCwS5z1o8Tri3+SUh8Lj8KZ9aPE4qIj+A6YbVSRCdcBlGIio9AgtHnF+b8OGH9lVc9xUfwzIRYNqRqdR1EQWUtFVIgCNuwUmblExCFWf4E6wj44jf0KojC0GvEPwUCIBHaHH6p++BvxH8KBGFza8q6fh1EYWJZqsPrHO9UnAJxzC+CKBjmrsCQxftwRYl3OgG9iZ8msWXDH7+sgCgwk+GLH5MAUSbtbvzZyAiIgg0NoYtJnvyeApQsnhhQO8sANGMAMyqSbWsgCEpDycGDIArKpNgMNBAE8VM2QhRU1g8/ZksSlAkRhd/40/WXjhwBUVAmRVKY5nWOtwNKUlxRxO9ASuFhBOIgCkoNqsMgCgVTeKiiOIgC+WUfDkgpPD/86IDHZB83QFfi78MBpSOHnTo8z3nAwWOUFxYFlZVAOgaCIH45NOpxBm8s7UFlJWC++P06oB9+bBsOgcRvAL/xxxHEMfkr/hwQ04ye/Nu2Lk2DTwOwC956Cj3e0xsXuHAJk+SYR2btXtNaL8sS6es3cI7xKHQCnIoAwzITSnCrALlVgdr9d6C+lOY0zlOj4yy0/wlonVWiLpje5lm8HMdsQw46gcsfULYKkKZX6I0XfEp1XhLA6RpoN3FMZYkfBNCYimk7BCB+zJo465/dzjvvAnrFH0TBoW0XTNMr9MaL8cbrzjhPOX0GBp7ZOtHglGXe7fdywCiKi5aNHSQ8Sudgo3lxpTyjG/ahWt08tFwszdK+UmVtc+VYFsfBNAiNQ+eIooVFSWAuSHiUqlv5OMWr+fkZq1Y6ZFbyh9buzM+ufDzF64Vr0OyIVBYXcX5sf/NbKM6FxwnipfynUC4vzZq6PmbUamOl1aU52oeZjk0VMKf9UhRvgDh0iJppJlq7X5c/f28JCrV9s8vyz8cw/mMY/zkS4nbxRwOIQ4egrAiKK+o8SLj8NK+HqbrKT34K+vTFWXOlOGbcujlWv3hxjvYZC5vTqFSW6vB6P3B7fzeDCbXJ/cjxUHwYA57B7PVzLd+hnktfuZHK3y9OYq7xbGzvEIuEB50DQXobo1YnG85BB6ALoA6NNbY41O//Dar5BW5b1Qzn8NyBx29lmvkXL1up8me/m8R88tngvjNsIPYtCoHzNozEs0L8AwPBjW1yvDWck7O4TfypFv6JxcsjU0Xj7lSgvHwWU2lA7w4SAireBKzUMT89Abvjz2bHLUuPZO4Hnkp989TPMgB/xaMvOfwY/ymM/1Qj/uA3/oDtl752eGNTf/0NFN008NVyxsL2x66+n2k6ewJFNmU9/8IUnnNWffppcN+alr9xHPg7723Lv60A3SdguquwUdw0rXbC20Ajue0I8d7SyjSW0UiIAUWBslUfgw7hPgGTq6GouKUvN4TX/gPwRnLfEWL15mvTWEYjIUqBYdAtJsRP3R+5GnZ33LSMnfA7QixZ+RlMp2kkRBnbX6t1zs+Ba/QETI5HwqtJD2eK6unUI6deygDMbzm/EX9HiBj/mUb8QTT+7hMwuVqdhHf7TkN47T9Ab7xc4AjRfv7FGRSiRkKkaRzO7W35PUe4NMbDH0/htaIRiMfo2wQMxLO4rskKE0ps1pfomoPnhW9FQwiPLb4JGgrxWSyv4WBaiL9aWeFrYvxJ+jaktJKfFOVHziKN8xrtTz38fXKc9x9YrhH/ZCP+9JGQcPwNdD2Dg6fwWtEQYpK+DUEhTuKdrOFcplhi+0oXvi3wU4fI2Kmbdfw/8PuJfyffdojW8V+eSSW+hhteKQAAAABJRU5ErkJggg==) !important;
}
.signature-pad-passive, .signature-placeholder:after {
background-image: url(data:image/svg+xml;base64,PHN2ZyB3aWR0aD0iMTk4IiBoZWlnaHQ9IjQwIiB2aWV3Qm94PSIwIDAgMTk4IDQwIiBmaWxsPSJub25lIiB4bWxucz0iaHR0cDovL3d3dy53My5vcmcvMjAwMC9zdmciPgo8cGF0aCBkPSJNNzQuMTA0NCA2LjM0NTA4SDc1LjU4NTlDNzUuNTQxMiA0LjcxNDQgNzQuMDk5NCAzLjUzMTE2IDcyLjAzMTIgMy41MzExNkM2OS45ODc5IDMuNTMxMTYgNjguNDIxOSA0LjY5OTQ4IDY4LjQyMTkgNi40NTQ0NkM2OC40MjE5IDcuODcxMzYgNjkuNDM2MSA4LjcwMTYyIDcxLjA3MTcgOS4xNDQwOUw3Mi4yNzQ5IDkuNDcyMjFDNzMuMzYzNiA5Ljc2MDU2IDc0LjIwMzggMTAuMTE4NSA3NC4yMDM4IDExLjAyMzNDNzQuMjAzOCAxMi4wMTc3IDczLjI1NDMgMTIuNjczOSA3MS45NDY3IDEyLjY3MzlDNzAuNzYzNSAxMi42NzM5IDY5Ljc3OTEgMTIuMTQ2OSA2OS42ODk2IDExLjAzODNINjguMTQ4NEM2OC4yNDc5IDEyLjg4MjcgNjkuNjc0NyAxNC4wMjEyIDcxLjk1NjcgMTQuMDIxMkM3NC4zNDggMTQuMDIxMiA3NS43MjUxIDEyLjc2MzQgNzUuNzI1MSAxMS4wMzgzQzc1LjcyNTEgOS4yMDM3NSA3NC4wODk1IDguNDkyODEgNzIuNzk2OSA4LjE3NDYzTDcxLjgwMjYgNy45MTYxQzcxLjAwNzEgNy43MTIyNyA2OS45NDgyIDcuMzM5NCA2OS45NTMxIDYuMzY0OTdDNjkuOTUzMSA1LjQ5OTkxIDcwLjc0MzYgNC44NTg1OCA3MS45OTY0IDQuODU4NThDNzMuMTY0OCA0Ljg1ODU4IDczLjk5NSA1LjQwNTQ1IDc0LjEwNDQgNi4zNDUwOFoiIGZpbGw9IiM4Nzk1QUIiLz4KPHBhdGggZD0iTTc3LjQ0MTYgMTMuODUyMkg3OC45MjgxVjYuMjE1ODJINzcuNDQxNlYxMy44NTIyWk03OC4xOTIzIDUuMDM3NTVDNzguNzA0NCA1LjAzNzU1IDc5LjEzMTkgNC42Mzk4MyA3OS4xMzE5IDQuMTUyNjFDNzkuMTMxOSAzLjY2NTM5IDc4LjcwNDQgMy4yNjI3IDc4LjE5MjMgMy4yNjI3Qzc3LjY3NTIgMy4yNjI3IDc3LjI1MjcgMy42NjUzOSA3Ny4yNTI3IDQuMTUyNjFDNzcuMjUyNyA0LjYzOTgzIDc3LjY3NTIgNS4wMzc1NSA3OC4xOTIzIDUuMDM3NTVaIiBmaWxsPSIjODc5NUFCIi8+CjxwYXRoIGQ9Ik04NC4xMjk2IDE2Ljg2Qzg2LjA3MzUgMTYuODYgODcuNTc0OSAxNS45NzAxIDg3LjU3NDkgMTQuMDIxMlY2LjIxNTgySDg2LjExODNWNy40NTM3NUg4Ni4wMDg5Qzg1Ljc0NTQgNi45ODE0NSA4NS4yMTg0IDYuMTE2MzkgODMuNzk2NSA2LjExNjM5QzgxLjk1MjEgNi4xMTYzOSA4MC41OTQ4IDcuNTczMDYgODAuNTk0OCAxMC4wMDQyQzgwLjU5NDggMTIuNDQwMyA4MS45ODE5IDEzLjczNzggODMuNzg2NiAxMy43Mzc4Qzg1LjE4ODYgMTMuNzM3OCA4NS43MzA1IDEyLjk0NzQgODUuOTk4OSAxMi40NjAxSDg2LjA5MzRWMTMuOTYxNkM4Ni4wOTM0IDE1LjEzOTggODUuMjczMSAxNS42NjE4IDg0LjE0NDUgMTUuNjYxOEM4Mi45MDY2IDE1LjY2MTggODIuNDI0NCAxNS4wNDA0IDgyLjE2MDkgMTQuNjE3OEw4MC44ODMyIDE1LjE0NDhDODEuMjg1OSAxNi4wNjQ1IDgyLjMwNSAxNi44NiA4NC4xMjk2IDE2Ljg2Wk04NC4xMTQ3IDEyLjUwNDlDODIuNzg3MyAxMi41MDQ5IDgyLjA5NjIgMTEuNDg1NyA4Mi4wOTYyIDkuOTg0MjlDODIuMDk2MiA4LjUxNzY3IDgyLjc3MjQgNy4zNzkxNyA4NC4xMTQ3IDcuMzc5MTdDODUuNDEyMyA3LjM3OTE3IDg2LjEwODMgOC40MzgxMiA4Ni4xMDgzIDkuOTg0MjlDODYuMTA4MyAxMS41NjAzIDg1LjM5NzQgMTIuNTA0OSA4NC4xMTQ3IDEyLjUwNDlaIiBmaWxsPSIjODc5NUFCIi8+CjxwYXRoIGQ9Ik05MS4wNTUgOS4zMTgwOUM5MS4wNTUgOC4xMDAwNSA5MS44MDA4IDcuNDA0MDMgOTIuODM0OSA3LjQwNDAzQzkzLjg0NDEgNy40MDQwMyA5NC40NTU2IDguMDY1MjUgOTQuNDU1NiA5LjE3MzkyVjEzLjg1MjJIOTUuOTQyMVY4Ljk5NDk0Qzk1Ljk0MjEgNy4xMDU3NCA5NC45MDMxIDYuMTE2MzkgOTMuMzQyIDYuMTE2MzlDOTIuMTkzNSA2LjExNjM5IDkxLjQ0MjggNi42NDgzNSA5MS4wODk4IDcuNDU4NzJIOTAuOTk1NFY2LjIxNTgySDg5LjU2ODVWMTMuODUyMkg5MS4wNTVWOS4zMTgwOVoiIGZpbGw9IiM4Nzk1QUIiLz4KPHBhdGggZD0iTTEwMS43NiAxMy44NTIySDEwMy4yOTZWOS40MTI1NUgxMDguMzcyVjEzLjg1MjJIMTA5LjkxNFYzLjY3MDM3SDEwOC4zNzJWOC4wOTUwOEgxMDMuMjk2VjMuNjcwMzdIMTAxLjc2VjEzLjg1MjJaIiBmaWxsPSIjODc5NUFCIi8+CjxwYXRoIGQ9Ik0xMTUuMzIzIDE0LjAwNjNDMTE2Ljk4OCAxNC4wMDYzIDExOC4xNjYgMTMuMTg2IDExOC41MDQgMTEuOTQzMUwxMTcuMDk3IDExLjY4OTVDMTE2LjgyOSAxMi40MTA0IDExNi4xODMgMTIuNzc4MyAxMTUuMzM4IDEyLjc3ODNDMTE0LjA2NSAxMi43NzgzIDExMy4yMSAxMS45NTMgMTEzLjE3IDEwLjQ4MTRIMTE4LjU5OVY5Ljk1NDQ2QzExOC41OTkgNy4xOTUyMiAxMTYuOTQ4IDYuMTE2MzkgMTE1LjIxOCA2LjExNjM5QzExMy4wOSA2LjExNjM5IDExMS42ODggNy43MzcxMyAxMTEuNjg4IDEwLjA4MzdDMTExLjY4OCAxMi40NTUyIDExMy4wNyAxNC4wMDYzIDExNS4zMjMgMTQuMDA2M1pNMTEzLjE3NSA5LjM2NzgxQzExMy4yMzUgOC4yODQgMTE0LjAyIDcuMzQ0MzcgMTE1LjIyOCA3LjM0NDM3QzExNi4zODIgNy4zNDQzNyAxMTcuMTM3IDguMTk5NDkgMTE3LjE0MiA5LjM2NzgxSDExMy4xNzVaIiBmaWxsPSIjODc5NUFCIi8+CjxwYXRoIGQ9Ik0xMjAuMjQ4IDEzLjg1MjJIMTIxLjczNVY5LjE4ODgzQzEyMS43MzUgOC4xODk1NCAxMjIuNTA1IDcuNDY4NjYgMTIzLjU1OSA3LjQ2ODY2QzEyMy44NjggNy40Njg2NiAxMjQuMjE2IDcuNTIzMzUgMTI0LjMzNSA3LjU1ODE1VjYuMTM2MjdDMTI0LjE4NiA2LjExNjM5IDEyMy44OTIgNi4xMDE0NyAxMjMuNzAzIDYuMTAxNDdDMTIyLjgwOSA2LjEwMTQ3IDEyMi4wNDMgNi42MDg1OCAxMjEuNzY1IDcuNDI4ODlIMTIxLjY4NVY2LjIxNTgySDEyMC4yNDhWMTMuODUyMloiIGZpbGw9IiM4Nzk1QUIiLz4KPHBhdGggZD0iTTEyOC42MzkgMTQuMDA2M0MxMzAuMzA1IDE0LjAwNjMgMTMxLjQ4MyAxMy4xODYgMTMxLjgyMSAxMS45NDMxTDEzMC40MTQgMTEuNjg5NUMxMzAuMTQ1IDEyLjQxMDQgMTI5LjQ5OSAxMi43NzgzIDEyOC42NTQgMTIuNzc4M0MxMjcuMzgxIDEyLjc3ODMgMTI2LjUyNiAxMS45NTMgMTI2LjQ4NiAxMC40ODE0SDEzMS45MTVWOS45NTQ0NkMxMzEuOTE1IDcuMTk1MjIgMTMwLjI2NSA2LjExNjM5IDEyOC41MzUgNi4xMTYzOUMxMjYuNDA3IDYuMTE2MzkgMTI1LjAwNSA3LjczNzEzIDEyNS4wMDUgMTAuMDgzN0MxMjUuMDA1IDEyLjQ1NTIgMTI2LjM4NyAxNC4wMDYzIDEyOC42MzkgMTQuMDA2M1pNMTI2LjQ5MSA5LjM2NzgxQzEyNi41NTEgOC4yODQgMTI3LjMzNiA3LjM0NDM3IDEyOC41NDUgNy4zNDQzN0MxMjkuNjk4IDcuMzQ0MzcgMTMwLjQ1NCA4LjE5OTQ5IDEzMC40NTkgOS4zNjc4MUgxMjYuNDkxWiIgZmlsbD0iIzg3OTVBQiIvPgo8cGF0aCBkPSJNMSAzNi4wMjI5QzEyLjI0NjEgMzkuMjIwNSAyMy4xODIgMzUuMDMyOCAzMi41MDg0IDI4Ljg1MTFDMzcuNDQwNCAyNS41ODIyIDQyLjMzNDEgMjEuNjY4NyA0NS4zMzI5IDE2LjUxMDFDNDYuNTI4MyAxNC40NTM5IDQ3Ljk4OTMgMTAuODg0NCA0NC4yMjcxIDEwLjg1MjhDNDAuMTMzNyAxMC44MTgzIDM3LjA4NjQgMTQuNTE0MiAzNS41NTg4IDE3Ljg3NDRDMzMuMzY4MSAyMi42OTMzIDMzLjI5MSAyOC40MDA0IDM1Ljk2NTYgMzMuMDQ0MUMzOC40OTcxIDM3LjQzOTYgNDIuNzQ0NSAzOS41MTg0IDQ3LjgxMTQgMzguNjYzOUM1My4xMDM3IDM3Ljc3MTMgNTcuNzMwNCAzNC4xNTYyIDYxLjU3NjUgMzAuNjc4NUM2Mi45OTMgMjkuMzk3NiA2NC4zMjA5IDI4LjA0NzUgNjUuNTQyIDI2LjU4NTdDNjUuNjg0MiAyNi40MTU1IDY2LjE4NDIgMjUuNTc5OCA2Ni41MDggMjUuNTIxOEM2Ni42Mjg0IDI1LjUwMDIgNjYuODA2NCAyOS4xNjQ1IDY2LjgzODUgMjkuMzY0M0M2Ny4xMjU1IDMxLjE1NDMgNjguMDI5NCAzMy4xNzA2IDcwLjE0MzEgMzMuMjMxOEM3Mi44MzMyIDMzLjMwOTcgNzUuMDgyNiAzMS4wNTkxIDc2Ljg5MjIgMjkuNDAxOEM3Ny41MDI2IDI4Ljg0MjggNzkuNDQyNSAyNi4xNjAxIDgwLjQ3NjQgMjYuMTYwMUM4MC45MDE0IDI2LjE2MDEgODEuNzI0OSAyOC4zMDM4IDgxLjkxMjcgMjguNTg4M0M4NC4zOTcyIDMyLjM1MjMgODguMDQ0NiAzMC45ODk0IDkwLjg3MzMgMjguMzUwNUM5MS4zOTM0IDI3Ljg2NTMgOTQuMTc4MSAyMy45ODM5IDk1LjMwOTEgMjQuNjgzMkM5Ni4yMjAzIDI1LjI0NjYgOTYuNjIxNyAyNi41NzY1IDk3LjA4ODYgMjcuNDYxOEM5Ny44NDg0IDI4LjkwMjkgOTguODEwNyAyOS45Mjk0IDEwMC40MTkgMzAuNDY1N0MxMDMuOTEyIDMxLjYzMSAxMDcuNjggMjguMzYzIDExMS4yMjIgMjguMzYzQzExMi4yNTUgMjguMzYzIDExMi43ODMgMjguOTMxNiAxMTMuMzMyIDI5LjcxNDhDMTE0LjA4MSAzMC43ODIzIDExNC44NTMgMzEuNTI3NiAxMTYuMjA1IDMxLjgxNzVDMTIwLjM5MyAzMi43MTU1IDEyMy44MjIgMjguNzM5OSAxMjcuODcyIDI5LjA4ODlDMTI5LjA1MyAyOS4xOTA3IDEyOS45MzUgMzAuMzgxNiAxMzAuODIxIDMxLjAxNjRDMTMyLjYwOSAzMi4yOTY5IDEzNC43NTkgMzMuMTgzNiAxMzYuOTQ4IDMzLjQ5NDdDMTQwLjQ1NyAzMy45OTM0IDE0My45NzUgMzMuMzMyNiAxNDcuMzk1IDMyLjU5MzVDMTUzLjMgMzEuMzE3NCAxNTkuMTQ3IDI5Ljc5NTggMTY1LjA2MiAyOC41NjMzIiBzdHJva2U9IiNERkUzRUQiIHN0cm9rZS13aWR0aD0iMS41IiBzdHJva2UtbGluZWNhcD0icm91bmQiIHN0cm9rZS1saW5lam9pbj0icm91bmQiLz4KPHBhdGggZD0iTTE5Ni41MTUgMTUuMDc3OEwxODQuNDkyIDAuNTUxNzk1QzE4NC4yNTcgMC4yNjc4MSAxODMuODM4IDAuMjI4MjYgMTgzLjU1NCAwLjQ2MzMwN0wxODAuNjQ5IDIuODY3ODhDMTgwLjM2NSAzLjEwMjkzIDE4MC4zMjUgMy41MjI0IDE4MC41NiAzLjgwNjM4TDE5Mi41ODMgMTguMzMyNEMxOTIuNyAxOC40NzQxIDE5Mi44NjQgMTguNTU1MSAxOTMuMDM0IDE4LjU3MTJDMTkzLjIwNCAxOC41ODcyIDE5My4zOCAxOC41MzgyIDE5My41MjIgMTguNDIwOUwxOTYuNDI3IDE2LjAxNjRDMTk2LjcxMSAxNS43ODEzIDE5Ni43NSAxNS4zNjE4IDE5Ni41MTUgMTUuMDc3OFoiIGZpbGw9IiNERkUzRUQiLz4KPHBhdGggZD0iTTE4MS40MzYgNi45NTc2OUwxNzAuODU1IDkuODI2NDJDMTcwLjYyMiA5Ljg4OTUgMTcwLjQ0MSAxMC4wNzMzIDE3MC4zODMgMTAuMzA3NkwxNjYuMTU1IDI3LjEwMjFMMTczLjk3NSAyMC42Mjk2QzE3My4yNDUgMTkuMjYxNyAxNzMuNTUgMTcuNTE5NCAxNzQuNzkgMTYuNDkyNkMxNzYuMjA2IDE1LjMyMDMgMTc4LjMxMiAxNS41MTk2IDE3OS40ODMgMTYuOTM1MUMxODAuNjU1IDE4LjM1MTMgMTgwLjQ1NiAyMC40NTY2IDE3OS4wNDEgMjEuNjI4MkMxNzguMzMzIDIyLjIxNDQgMTc3LjQ1MiAyMi40NTgyIDE3Ni42MDMgMjIuMzc4MUMxNzUuOTY0IDIyLjMxNzkgMTc1LjM0MyAyMi4wNzQ1IDE3NC44MjUgMjEuNjU3M0wxNjcuMDA1IDI4LjEyOTFMMTg0LjI5NCAyNy4xMTQyQzE4NC41MzQgMjcuMTAwMSAxODQuNzQ5IDI2Ljk1NzYgMTg0Ljg1NCAyNi43NDA2TDE4OS42NSAxNi44ODE5TDE4MS40MzYgNi45NTc2OVoiIGZpbGw9IiNERkUzRUQiLz4KPC9zdmc+Cg==);
}
.form-spinner-button.form-spinner-up:before {
background-image: url(data:image/svg+xml;base64,PHN2ZyB3aWR0aD0iMTQiIGhlaWdodD0iMTQiIHZpZXdCb3g9IjAgMCAxNCAxNCIgZmlsbD0ibm9uZSIgeG1sbnM9Imh0dHA6Ly93d3cudzMub3JnLzIwMDAvc3ZnIj4KPHBhdGggZmlsbC1ydWxlPSJldmVub2RkIiBjbGlwLXJ1bGU9ImV2ZW5vZGQiIGQ9Ik03LjUgMTIuNUw3LjUgNy41TDEyLjUgNy41QzEyLjc3NiA3LjUgMTMgNy4yNzYgMTMgN0MxMyA2LjcyNCAxMi43NzYgNi41IDEyLjUgNi41TDcuNSA2LjVMNy41IDEuNUM3LjUgMS4yMjQgNy4yNzYgMSA3IDFDNi43MjQgMSA2LjUgMS4yMjQgNi41IDEuNUw2LjUgNi41TDEuNSA2LjVDMS4yMjQgNi41IDAuOTk5OTk5IDYuNzI0IDAuOTk5OTk5IDdDMC45OTk5OTkgNy4yNzYgMS4yMjQgNy41IDEuNSA3LjVMNi41IDcuNUw2LjUgMTIuNUM2LjUgMTIuNzc2IDYuNzI0IDEzIDcgMTNDNy4yNzYgMTMgNy41IDEyLjc3NiA3LjUgMTIuNVoiIGZpbGw9IiM1NjY1N0UiIHN0cm9rZT0iIzU2NjU3RSIgc3Ryb2tlLXdpZHRoPSIwLjUiLz4KPC9zdmc+Cg==);
}
.form-spinner-button.form-spinner-down:before {
background-image: url(data:image/svg+xml;base64,PHN2ZyB3aWR0aD0iMTQiIGhlaWdodD0iMyIgdmlld0JveD0iMCAwIDE0IDMiIGZpbGw9Im5vbmUiIHhtbG5zPSJodHRwOi8vd3d3LnczLm9yZy8yMDAwL3N2ZyI+CjxwYXRoIGQ9Ik0xMi41IDJMNy41IDJMMS41IDJDMS4yMjQgMiAxIDEuNzc2IDEgMS41QzEgMS4yMjQgMS4yMjQgMC45OTk5OTkgMS41IDAuOTk5OTk5TDYuNSAxTDEyLjUgMUMxMi43NzYgMSAxMyAxLjIyNCAxMyAxLjVDMTMgMS43NzYgMTIuNzc2IDIgMTIuNSAyWiIgZmlsbD0iIzU2NjU3RSIgc3Ryb2tlPSIjNTY2NTdFIiBzdHJva2Utd2lkdGg9IjAuNSIvPgo8L3N2Zz4K);
}
.form-collapse-table:after{
background-image: url(data:image/svg+xml;base64,PHN2ZyB3aWR0aD0iMTEiIGhlaWdodD0iMTEiIHZpZXdCb3g9IjAgMCAxMSAxMSIgZmlsbD0ibm9uZSIgeG1sbnM9Imh0dHA6Ly93d3cudzMub3JnLzIwMDAvc3ZnIj4KPGNpcmNsZSBjeD0iNS41IiBjeT0iNS41IiByPSI1LjUiIHRyYW5zZm9ybT0icm90YXRlKC05MCA1LjUgNS41KSIgZmlsbD0iI0MzQ0FEOCIgZmlsbC1vcGFjaXR5PSIwLjUiLz4KPHBhdGggZD0iTTMuMTY3NTYgNC40NjExMkMzLjE0NzkzIDQuNTAzMDggMy4xMzk2MSA0LjU1MDA4IDMuMTQzNTIgNC41OTY4M0MzLjE0NzQzIDQuNjQzNTggMy4xNjM0MyA0LjY4ODI0IDMuMTg5NzIgNC43MjU3OUw1LjMxMTE1IDcuNzU2NEM1LjMzMzEgNy43ODc3NyA1LjM2MTU3IDcuODEzMjMgNS4zOTQzIDcuODMwNzZDNS40MjcwMyA3Ljg0ODI5IDUuNDYzMTIgNy44NTc0MiA1LjQ5OTcyIDcuODU3NDJDNS41MzYzMSA3Ljg1NzQyIDUuNTcyNCA3Ljg0ODI5IDUuNjA1MTMgNy44MzA3NkM1LjYzNzg2IDcuODEzMjMgNS42NjYzMyA3Ljc4Nzc3IDUuNjg4MjkgNy43NTY0TDcuODA5NzIgNC43MjU3OUM3Ljg0MDMyIDQuNjgyMDcgNy44NTY4NiA0LjYyODkgNy44NTY4NiA0LjU3NDI2QzcuODU2NzIgNC41MzQ5OSA3Ljg0ODE4IDQuNDk2MjkgNy44MzE4OCA0LjQ2MTEyQzcuODEyMjggNC40MTkyMiA3Ljc4MjE5IDQuMzgzOTkgNy43NDQ5OCA0LjM1OTM3QzcuNzA3NzYgNC4zMzQ3NSA3LjY2NDg5IDQuMzIxNzEgNy42MjExNSA0LjMyMTcxTDMuMzc4MjkgNC4zMjE3MUMzLjMzNDU1IDQuMzIxNzEgMy4yOTE2NyA0LjMzNDc1IDMuMjU0NDYgNC4zNTkzN0MzLjIxNzI0IDQuMzgzOTkgMy4xODcxNSA0LjQxOTIyIDMuMTY3NTYgNC40NjExMlY0LjQ2MTEyWiIgZmlsbD0iI0U1RTdGMSIvPgo8L3N2Zz4K);
}
li[data-type=control_fileupload] .qq-upload-button:before {
background-image: url(data:image/svg+xml;base64,PHN2ZyB3aWR0aD0iMzkiIGhlaWdodD0iMjciIHZpZXdCb3g9IjAgMCAzOSAyNyIgZmlsbD0ibm9uZSIgeG1sbnM9Imh0dHA6Ly93d3cudzMub3JnLzIwMDAvc3ZnIj4KPHBhdGggZD0iTTMyLjM3NSAxMS4zMTI1QzMxLjUgNC44MTI1IDI2IDAgMTkuMzc1IDBDMTMuNjg3NSAwIDguNzUgMy41NjI1IDYuOTM3NSA4LjkzNzVDMi44NzUgOS44MTI1IDAgMTMuMzEyNSAwIDE3LjVDMCAyMi4wNjI1IDMuNTYyNSAyNS44NzUgOC4xMjUgMjYuMjVIMzEuODc1SDMxLjkzNzVDMzUuNzUgMjUuODc1IDM4Ljc1IDIyLjYyNSAzOC43NSAxOC43NUMzOC43NSAxNS4wNjI1IDM2IDExLjg3NSAzMi4zNzUgMTEuMzEyNVpNMjYuMDYyNSAxNC44MTI1QzI1LjkzNzUgMTQuOTM3NSAyNS44MTI1IDE1IDI1LjYyNSAxNUMyNS40Mzc1IDE1IDI1LjMxMjUgMTQuOTM3NSAyNS4xODc1IDE0LjgxMjVMMjAgOS42MjVWMjEuODc1QzIwIDIyLjI1IDE5Ljc1IDIyLjUgMTkuMzc1IDIyLjVDMTkgMjIuNSAxOC43NSAyMi4yNSAxOC43NSAyMS44NzVWOS42MjVMMTMuNTYyNSAxNC44MTI1QzEzLjMxMjUgMTUuMDYyNSAxMi45Mzc1IDE1LjA2MjUgMTIuNjg3NSAxNC44MTI1QzEyLjQzNzUgMTQuNTYyNSAxMi40Mzc1IDE0LjE4NzUgMTIuNjg3NSAxMy45Mzc1TDE4LjkzNzUgNy42ODc1QzE5IDcuNjI1IDE5LjA2MjUgNy41NjI1IDE5LjEyNSA3LjU2MjVDMTkuMjUgNy41IDE5LjQzNzUgNy41IDE5LjYyNSA3LjU2MjVDMTkuNjg3NSA3LjYyNSAxOS43NSA3LjYyNSAxOS44MTI1IDcuNjg3NUwyNi4wNjI1IDEzLjkzNzVDMjYuMzEyNSAxNC4xODc1IDI2LjMxMjUgMTQuNTYyNSAyNi4wNjI1IDE0LjgxMjVaIiBmaWxsPSIjQjNCQ0NDIi8+Cjwvc3ZnPgo=);
}
.appointmentDayPickerButton {
background-image: url(data:image/svg+xml;base64,PHN2ZyB3aWR0aD0iOCIgaGVpZ2h0PSIxNCIgdmlld0JveD0iMCAwIDggMTQiIGZpbGw9Im5vbmUiIHhtbG5zPSJodHRwOi8vd3d3LnczLm9yZy8yMDAwL3N2ZyI+CjxwYXRoIGQ9Ik0xIDEzTDcgN0wxIDAuOTk5OTk5IiBzdHJva2U9IiM4Nzk1QUMiIHN0cm9rZS13aWR0aD0iMiIgc3Ryb2tlLWxpbmVjYXA9InJvdW5kIiBzdHJva2UtbGluZWpvaW49InJvdW5kIi8+Cjwvc3ZnPgo=);
}
/* NEW THEME STYLE */
/*PREFERENCES STYLE*/
/*PREFERENCES STYLE*/
.form-all {
font-family: Inter, sans-serif;
}
.form-all .qq-upload-button,
.form-all .form-submit-button,
.form-all .form-submit-reset,
.form-all .form-submit-print {
font-family: Inter, sans-serif;
}
.form-all .form-pagebreak-back-container,
.form-all .form-pagebreak-next-container {
font-family: Inter, sans-serif;
}
.form-header-group {
font-family: Inter, sans-serif;
}
.form-label {
font-family: Inter, sans-serif;
}
.form-label.form-label-auto {
display: block;
float: none;
text-align: left;
width: 100%;
}
.form-line {
margin-top: 6px 10px 7px 10pxpx;
margin-bottom: 6px 10px 7px 10pxpx;
}
.form-all {
max-width: 752px;
width: 100%;
}
.form-label.form-label-left,
.form-label.form-label-right,
.form-label.form-label-left.form-label-auto,
.form-label.form-label-right.form-label-auto {
width: 230px;
}
.form-all {
font-size: 16px
}
.form-all .qq-upload-button,
.form-all .qq-upload-button,
.form-all .form-submit-button,
.form-all .form-submit-reset,
.form-all .form-submit-print {
font-size: 16px
}
.form-all .form-pagebreak-back-container,
.form-all .form-pagebreak-next-container {
font-size: 16px
}
.supernova {
background-color: #F3F3FE;
}
.supernova body {
background: transparent;
}
.supernova .form-all, .form-all {
background-color: #FFFFFF;
}
.form-all {
color: #2C3345;
}
.form-header-group .form-header {
color: #2C3345;
}
.form-header-group .form-subHeader {
color: #2C3345;
}
.form-label-top,
.form-label-left,
.form-label-right,
.form-html,
.form-checkbox-item label,
.form-radio-item label {
color: #2C3345;
}
.form-sub-label {
color: #464d5f;
}
.form-textbox,
.form-textarea,
.form-dropdown,
.form-radio-other-input,
.form-checkbox-other-input,
.form-captcha input,
.form-spinner input {
background-color: #FFFFFF;
}
.form-line-error {
overflow: hidden;
transition: none;
background-color: #FFD6D6;
}
.form-line-error .form-error-message {
background-color: #FF3200;
clear: both;
float: none;
}
.form-line-error .form-error-arrow {
border-bottom-color: #FF3200;
}
.form-line-error input:not(#coupon-input),
.form-line-error textarea,
.form-line-error .form-validation-error {
border: 1px solid #FF3200;
.box-shadow(0 0 3px #FF3200);
}
.supernova {
background-image: none;
}
#stage {
background-image: none;
}
.form-all {
background-image: none;
}
.ie-8 .form-all:before { display: none; }
.ie-8 {
margin-top: auto;
margin-top: initial;
}
/*PREFERENCES STYLE*//*__INSPECT_SEPERATOR__*/
/* Injected CSS Code */
Comments are closed