
Finding the Sweet Spot for your Forecast
By Jim Lewis, CEO Enhanced Retail Solutions LLC
A common challenge with forecasting over the last 12 months has been what to use as a baseline. The answer varies greatly by product category and retail distribution. It is a question that prompts us to ask many more questions to try and answer it. Here are a few:
- Were stores closed?
- Did online sales increase?
- Has the seasonality changed?
- Did delivery or other factors cause lost sales?
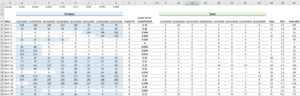
For these questions, the key underlying factor is time. Finding the “sweet spot”- a period of time that best represents the optimal selling opportunity- is the goal. We can take the rate of sale over the sweet spot, apply our seasonality logic and come up with future estimated sales. The math is not complicated, but it requires a good amount of data and time to get information in a format that is workable. Start by retrieving unit sales and on hand inventory (by store if available) by week from your data warehouse. Then follow these steps:
- In a spreadsheet, start in column A with the item ID and then placing on hand inventory by week going across. Leave a few columns blank and then add sales by week to the right of on hand ensuring the alignment by item is maintained. Be sure you have the corresponding dates in the first row.
- Use a COUNTIF formula to determine how many weeks the on hand inventory was appropriate to support sales. This is generally OH >0 but could be some higher number if 1 unit per store does not make a statement saleable.
- Sort the count highest to lowest. This enables us to separate items that will be easier to forecast than others. If in-stock at least 80% of the time, we can use a simple method to finish our forecast. For items below that we need to use other methods to find consecutive weeks when we were in business.
- For items with a lower in-stock, use conditional formatting to color fill every on hand >0. This is a quick way to visualize a consecutive period. Depending on your spreadsheet skills, you can also use other methods like MATCH or INDEX to try and find the period. Or contact us if you get stuck. If you can find at least a 4-week period, you have enough to proceed.
- Now take the sum of sales over the same corresponding time period and divide by the number of weeks. This is your rate of sale when you were in stock.
- Grab a sales curve appropriate for your item. Divide the sales by the sum of curve % for the corresponding period as the sweet spot (a SUMIF formula can help). This is the annual potential. Now you can multiply the annual potential by any other week along the curve to determine estimated sales for that period.
The more items you have with healthy in-stocks, the faster you can do the forecast. For those items with spotty inventory and sales, this method will work, but you need more mastery spreadsheet skills to write logic to find the sweet spot rather than rely on visuals and multiple sorting. If you get stumped, contact us, we have tools that can automate much of this process.
Comments are closed