
By Jim Lewis, CEO Enhanced Retail Solutions LLC
Disclaimer: I am not a digital marketing expert, nor do I play one on Disney+. However, our clients know we can visualize and make great use of any data. Lately, we have received several requests to make heads or tails of the data they collect from Facebook, Google, eBay, direct mail and other platforms they use to advertise online. They are looking to do a few things:
- Increase traffic to their site and increase followers/subscribers.
- Determine which platforms and campaigns generate the most sales and provide greatest ROI.
- Determine which products and categories generate the most sales.
- Budget advertising dollars appropriately among platforms.
What we do have great experience in is creating custom reports and dashboards. Here we will show you just one of many possible ways to approach these questions.
Organizing the Data
Since there are so many different data sources, the first step is aggregating the data. There are several services that do that or if you’re tech savvy, you can figure it out using API’s. Sales may come from a variety of sources also, but the easiest is using shipments from your ERP. Associated costs like freight and ad expense may be kept in separate files.
A spreadsheet is not the best place to aggregate and analyze this data. Any modern BI/Visualization tool is a better option. We use Microsoft PowerBI. There you can more easily integrate, filter, visualize, and create easy to read cards with the statistics you want. The key is organizing the data and creating relationships between campaign statistics, product sales and attributes. We can help you with that.
Visualizing the Data
Dashboards that integrate store and web and 3rd party data make them more actionable.
Another great reason to use a BI tool is it meets every user at their level. It can provide the big picture for executives and organize the raw data for the managers making the actual marketing decisions. Our example breaks down into 5 sections:
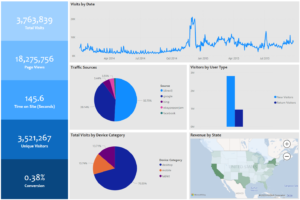
- Overview: Shows big picture statistics like page views, new visitors, conversion, traffic sources and geography.
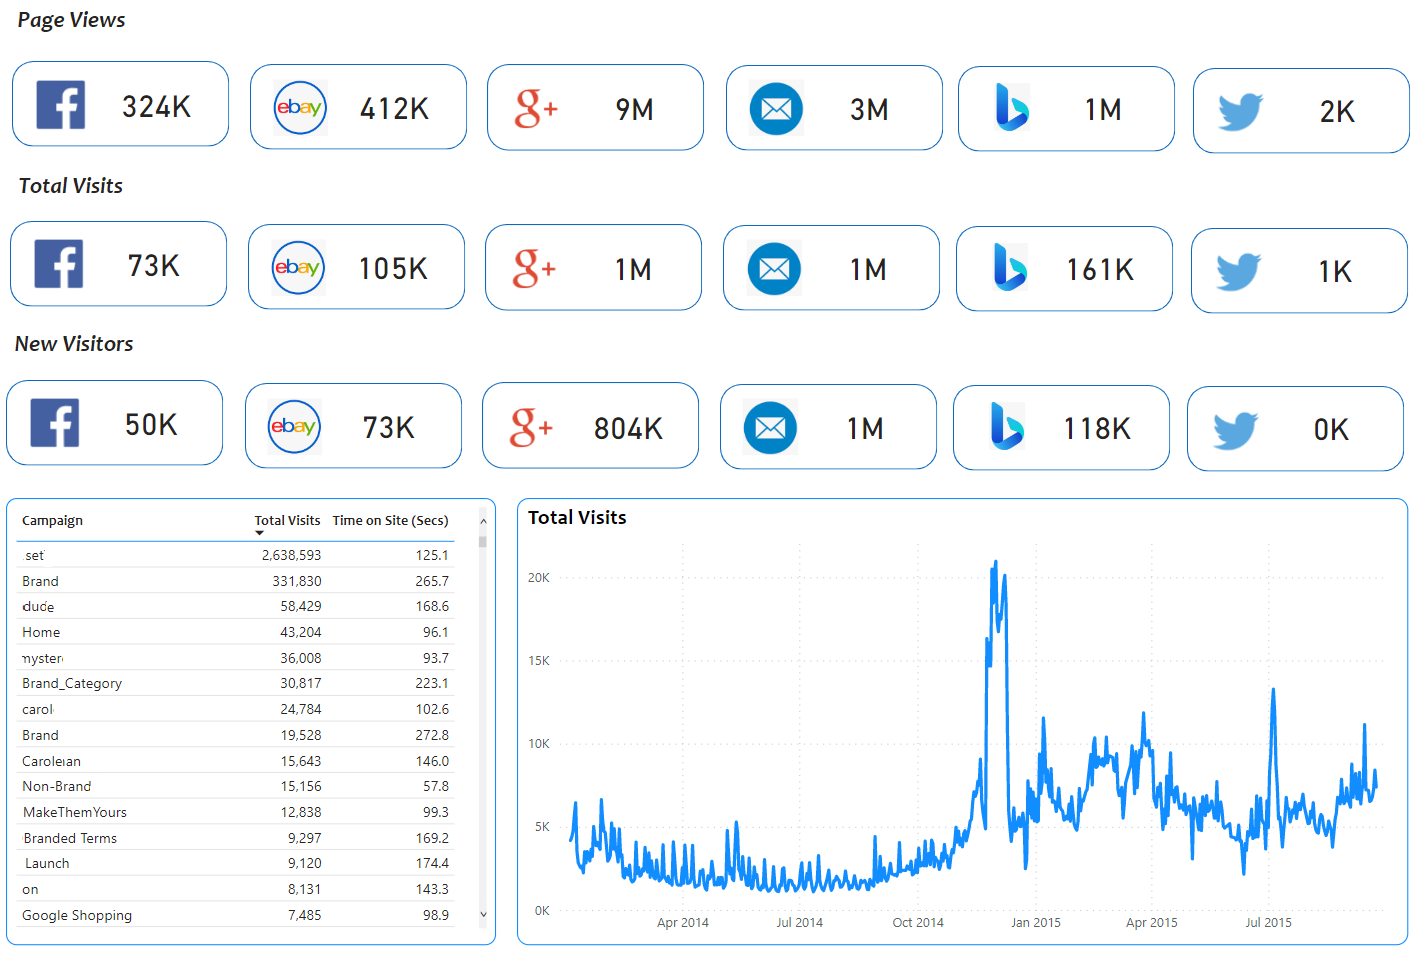
- Source: Shows the key statistics broken down by social network or marketing platform. Also shows the traffic by date. Clicking any point on the chart zeroes in on that day/campaign.
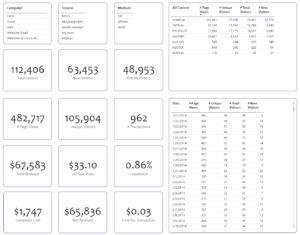
- Campaign Statistics: This focuses more on the specific marketing events- like a direct mail during a holiday or a special sale. Clicking on a campaign, source, medium or ad content location reveals the individual statistics.
- Blocks: Like many of our other dashboards, this highlights the best and worst. Highest revenue, most conversions, most new visitors, etc.
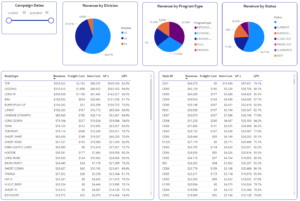
- Revenue & Growth: This focuses more on the products and categories and their profitability. From here we would incorporate a budget and show the actual vs. budget.
So much can be gleaned from the data, but it must be presented in such a way that you can quickly draw conclusions and make decisions. If data can just be refreshed and the dashboards update, then it’s more time for you to focus on learning. ERS can customize any of the statistics and views based on your own company’s unique strategies. Visit the Digital Marketing page on our website for more information.
Comments are closed