
By Jim Lewis, CEO Enhanced Retail Solutions
Wholesale inventory planners are used to working with POS data sets from the large retailers. That data has varying degrees of availability and complexity. If you sell a large number of retailers, managing the data is a job all within itself. The goal is to then make good use of the data. A question that commonly comes up from our clients is what to do about retailers that don’t provide sales data? In those cases, you are limited to studying the business based only on what you have shipped them.
Using Ship Data as Sales
Smaller retailers, boutiques, discounters, drop ship or direct retailers may fall into the category of not offering POS data. That could be due to lack of resources, confidentiality, or non-traditional buying processes. As a planner if your have an ERP system worth its salt, you should be able to extract ship data. While not optimal, there are insights that can be gained by taking ship data and turning it into sales data. What was purchased, when, and in what quantity. Reorder frequency and volume. You can find many other trends that can help you plan better and reduce risk of owning inventory for stores that fall into this category.

Shipment Frequency by Date by category by retailer
Data Points
At a minimum, you want a unique identifier of the SKU, quantity ordered, selling price, quantity shipped and the associated dates they took place. Style and attribute information is vital for trend analysis. For large manufacturers who sell hundreds or thousands of these smaller retailers it might make sense to set up each retailer as a store number under a fictitious chain. This will make aggregation easier down the road.
What Can Be Learned?
- Top Styles- You cannot calculate sell through, but you can study the volume and reorder frequency of styles. Of the top items are there any attributes they have in common such as style, color, size, etc.? Answers to those questions can help you plan better in the future.

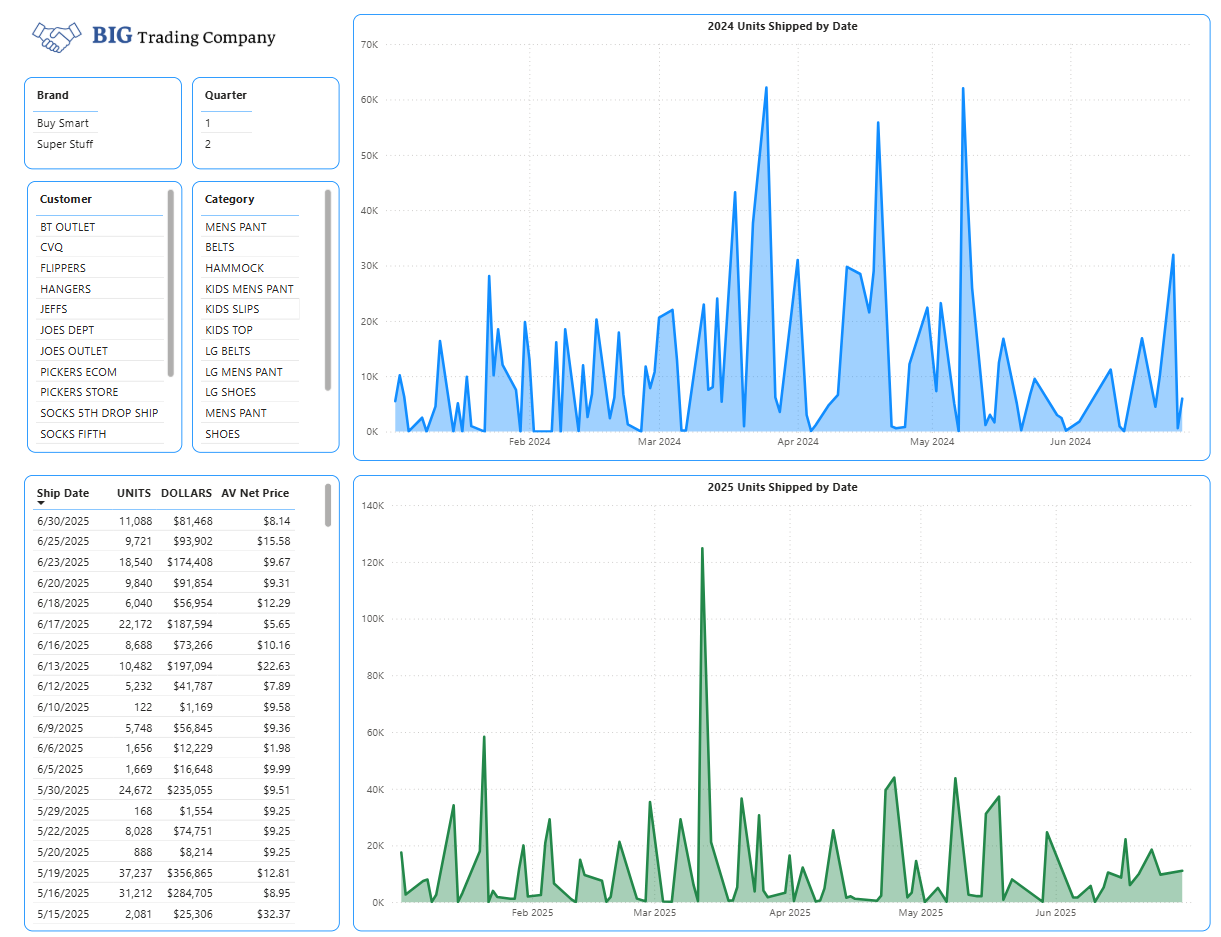
Use ERP Ship Data to visualize and track performance by customer, brand, category and item
- Year over year and other time frame comparisons. Which categories, items, or brands are growing or declining? You probably have a general sense based on dollars being generated, but analyzing the ship date in more detail can pinpoint specific opportunities or liabilities.
- Assortment Planning- study the number of SKU’s and styles ordered by month to get a sense of each retailer’s threshold. Are there certain categories that are reordered more often?
- Pricing- Is there a particular price range that works the best?
- Seasonality- Study the ship dates by category to understand when the retailer expects to start selling. Some of our clients take the ship date and add 30 days to treat is more like sales. These sales can also be fed into the forecasting process alongside sales from traditional retailers. If you produce product at your own risk, this is especially valuable. You don’t want to hold goods for too long and let the cost of capital reduce the margins on the product.

Number of styles shipped by retailer by date- helps with assortment planning.
Using shipment data you can inject more intelligence into your inventory planning process to understand what works can help reduce the risk of owning unwanted inventory.
Comments are closed