By Jim Lewis, CEO Enhanced Retail Solutions LLC
Even though tracking item performance is one of the most basic inventory planning functions, how it is implemented varies widely. The topic has come up a lot lately. Partly because the holiday season is upon us, but also curiosity around AI and its possible uses. This newsletter will break down our best practices of item tracking.
Philosophy
A good report must be actionable. And the user shouldn’t have to spend all their time trying to figure out what to do. In my opinion, the best reports tell you what to do. It’s great that sell through was 10%. What does that mean? Is it good or bad? Do I need more inventory, or do I have too much? Should we mark it down or promote it? How much? Do we expect this item to be viable 6 months from now? We need more background on the item to answer those questions. That’s where attributes become important.

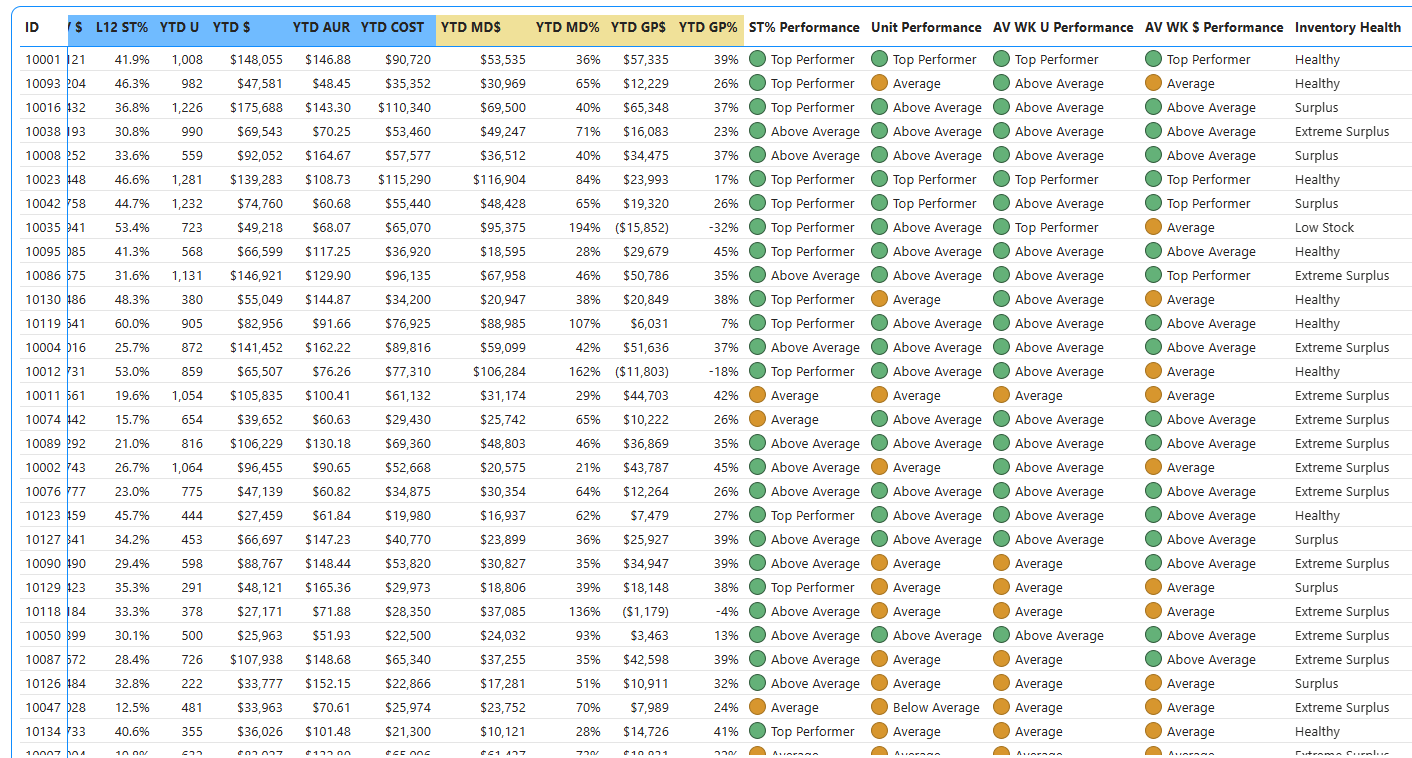
This example shows a report that blends numbers and the interpretation of those numbers to provide the user with recommended actions.
Attribute Management
Nothing is free in this world, and you can’t get around keeping attributes up to date. There are a few that are paramount to getting the results you want. Item status is probably the most important. Is the item active, discontinued or in limbo? Replenishment or fashion? For fashion businesses, the start season and expected end season are vital. A smart report can make recommendations to ensure an item meets its target out of stock date. Attributes add that color to an item’s story and a smart system can take advantage of that.

Item status is vital to make any report useful. No one wants to see a bunch of old items or irrelevant information.
Benchmarks
Not all items are created equal. To answer the question whether something is good or not, you need something to compare it to. If you have many product categories, judge each item against the average performance for that category. If there are other attributes that make sense, then use that. Determining the appropriate POS KPI’s is also paramount. You may be turning a lot of units but making no money. What is your goal? Step 1 is determining what you are going to benchmark. If more than one KPI is important, blend them. For example, if both sell through and dollar sales are most important, benchmark them both, then come up with a composite- like 60% of the score is based on sell through and 40% based on dollar sales.
Calculations and AI
If you have a category average, you can compare an individual item’s performance against that. We use the standard deviation to do that. If an item is 2.5 times better than the average, it’s a top performer. If it’s 1 time below the average, it’s below average. You can develop your own criteria and categorize performance based on your business. You can train an AI model to understand what is good or bad by feeding it this information. Over time, based on category, season and other attributes, it will be able to help determine those benchmarks. Taking one step further, once it knows the model, if it sees patterns in selling every week, it can help determine future performance based on a few weeks of data.
Visualize with Action
The fundamentals of retail analytics have not changed but reporting platforms and visualization tools sure have. We love spreadsheets but interactive visualization tools are much more powerful and easier to use. If I just want to see what needs to be bought, I can get to it quickly. If we want to highlight exceptions or include images or connect to other data sources and have accessibility on any device at any time… visualization tool wins every time.
The last column gives the user a recommendation on what to do. It interprets the numbers for the user.
Comments are closed