
By Jim Lewis, CEO Enhanced Retail Solutions LLC
Just about every company does it. Using retail analytics to answer a specific question on Monday morning. It’s the most fundamental question of running a business: How was business last week? Answering that question can be very simple or very hard and time-consuming based on a company’s resources. For retailers it can be straightforward. But for wholesalers it can be more difficult because they have more data sources. Each retailer they service has a data feed plus any direct business they do comes from ERP.
Data Collection
The collecting of the data is tricky because not only are there multiple data sources, but the data itself comes in different formats. Web portals, EDI, text or excel files that get emailed, etc. Companies manage it internally or use a service like ERS’ POS Data Management Service. Once the data is collected, the reporting begins to turn raw data into intelligence. Capabilities are wide ranging when it comes to reporting. Many companies spend hours putting together very detailed reports that are just a bunch of numbers on a page.
Intelligent Reports
Smart reports don’t just show numbers, they guide the reader to their meaning and recommend action. Different people in the organization require different levels of information. Executives care about the big picture but may not care about which specific stores at a specific retailer are sold out. So we tell companies to build a library of reports that show data at various levels based on need.
The Monday Morning Scorecard
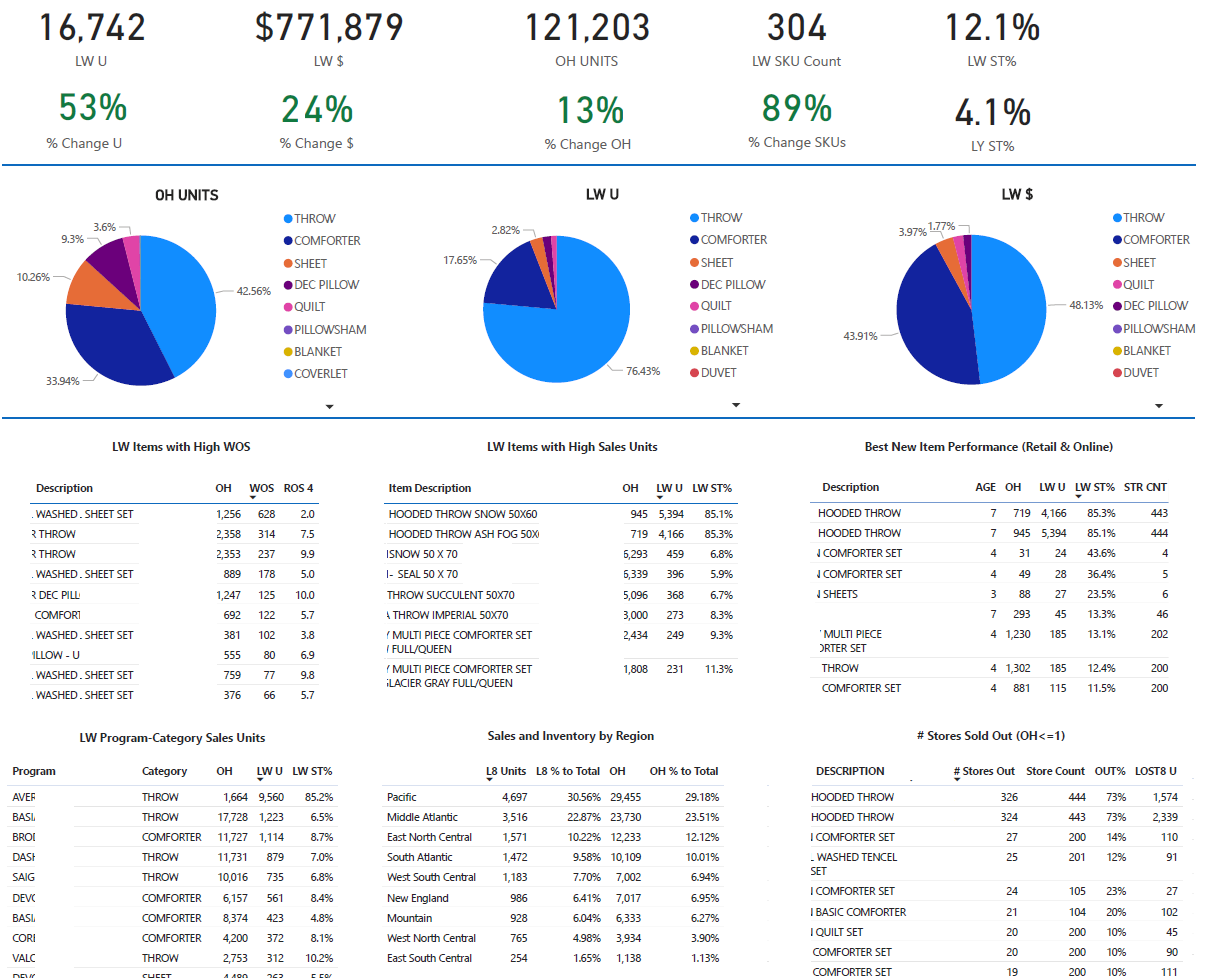
Back to Monday, for us a scorecard is a great way to easily get a grasp of the business in one page. It should contain 3 primary elements:
- Comparison of KPI’s this year vs last year. We like to compare sales units, dollars, sell through, inventory level and the number of SKUs in the assortment. Then we can truly understand if having more or less items, more or less inventory has an impact on sales.
- Graphs or charts that easily show what parts of the business (categories or brands, etc.) generated the sales. We look at sales units, sales dollars, and inventory. Inventory is especially important, so we know where the bulk of our capital investment is. Hopefully in categories that are generating the most sales.
- Small “chunks” of data that hit the most important things you want to know. They vary by business. The most common are Items with High inventory levels, Items with high sales, new item performance, category and brand sales, sales by region and stores that are sold out. Each of these offers the opportunity to act. Stores sold out could lead to additional orders and enable the calculation of lost sales. Tracking new items lets you catch a trend early.
For each of these blocks, it’s important to put it in context. For example, a new item can have very high sell through but maybe they only sold 5 units. So, you need to provide store counts, inventory, channel information (online vs. physical store), etc. Doing as much calculation as possible in the scorecard saves the reader time and gives them information they can use right away. Finding an item that is missing sales and having an estimate of lost sales right on the report enables the reader to pick up the phone and talk to the buyer with a hard number.
No matter what your reporting capability is, simple is usually best. It’s worth investing the time upfront to ask what users end up doing with reports. What decisions do they make from them and what is their thought process. Backing that logic into a report to give the final answer to the reader pushes your reporting to a higher level.
For more information about smart reporting, contact us.
Comments are closed