By Jim Lewis, CEO Enhanced Retail Solutions LLC
Okay, it’s not 2 days, it’s more like a month-long event now. Regardless of how many days it is, the combination of Black Friday and Cyber-Monday is a huge percentage of most retailers’ business. How it will affect the rest of the holiday selling season will soon be revealed. Time to get your retail analytic hats on.
While the numbers are still fresh, it’s a great time to review your business and see what intelligence can be gleaned. More importantly, closely studying the business will help you understand whether your current inventory will enable you to meet the rest of your holiday forecast and beyond. While you may not be able to secure more inventory immediately, you can at least set yourself up for a successful spring.
Retail Analytics
Looking back at what happened helps you plan for the future. Here are 5 questions we ask, along with recommendations of how to answer them.
Question 1
What worked and what didn’t? We recommend putting together a grid- with pictures if possible. What attributes did the winners and losers have- was there anything in common? For example, was there commonality with a particular silhouette, color, fabric or product feature. A smart report that ranks items and shows current inventory health is helpful as well. Making assortment adjustments should be done on a continual basis as you strive to improve productivity and profitability.
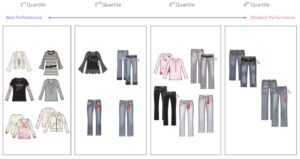
Sometimes a visualization is easier to spot a trend than numbers in a spreadsheet. Looks like tops drove the business.
Question 2
What channels generated the most business? For Retail- did any stores sell out? How quickly? Adjusting store inventory allocation will balance out inventory- ensuring the top stores can generate more sales and the bottom stores aren’t tied down with inventory they don’t need.
For online, was inventory sufficient? How productive were additions to the assortment that were not at retail? If significantly more traffic was driven online and only a small percentage of the assortment generated sales then it may be a good time to conduct sku optimization. Estimate lost sales over the last 4 weeks by looking at stock position by store and determining rate of sale for weeks when stores were in business.
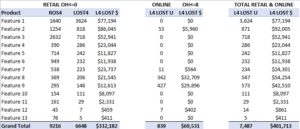
Calculate lost sales for both retail stores and online. Stores that sold out early could have sold more.
Question 3
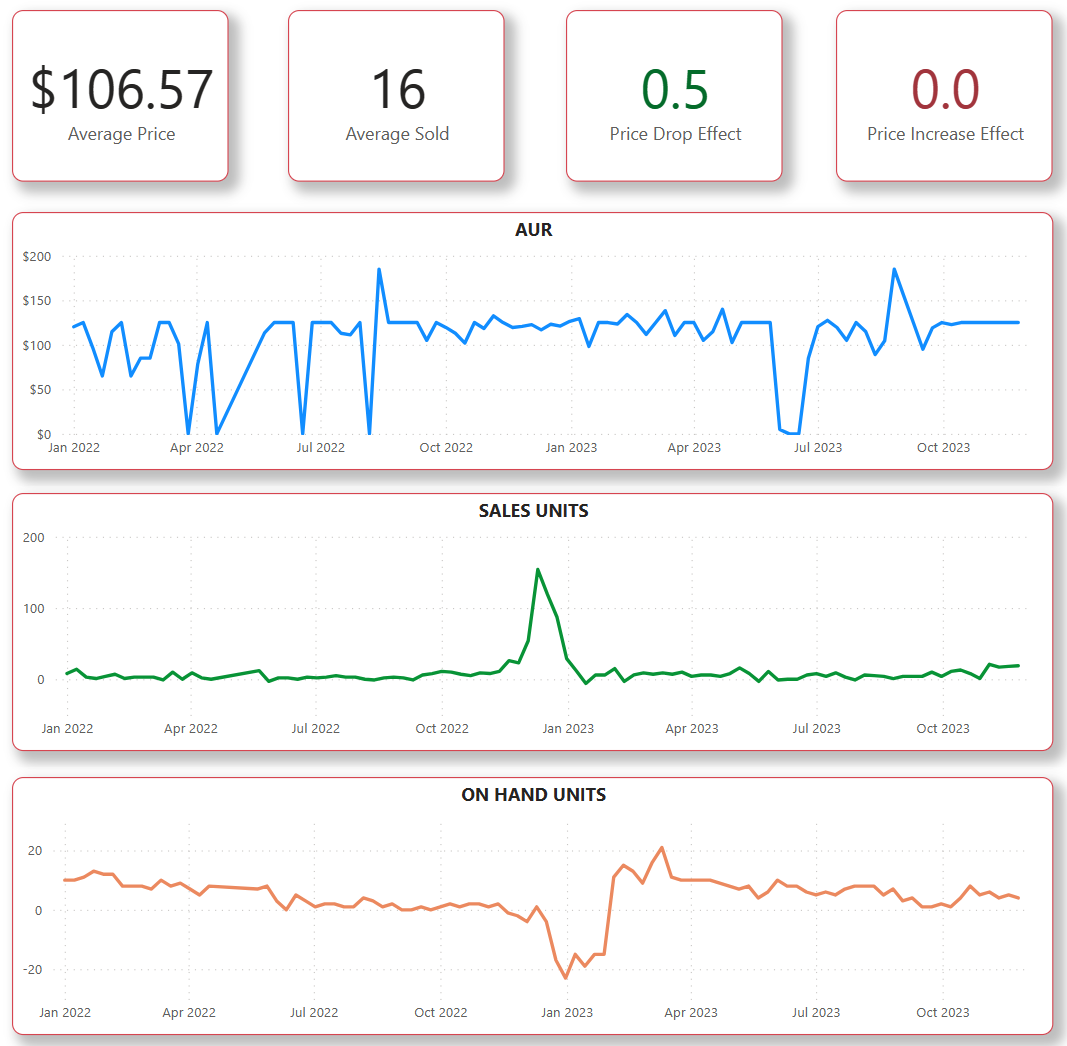
Were promotional efforts productive? You may have sold a lot of units, but did you make money? Conduct a price elasticity exercise to determine what usually happens to sales when you increase or decrease the price. Some items are not affected by large decreases in price so there’s no reason to promote them and leave money on the table. You need a decent amount of history to do this. The more weeks of data you have and the more correlations you have of seeing a trend (ex., sales go down when price goes up) the more confident you can be with the analysis.
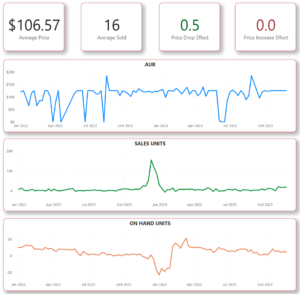
In this case an increase in price had no effect on sales and a decrease in price had a minimal effect. So why promote it?
Question 4
Is your inventory balanced? For items that did well, are you left vulnerable for the rest of the season? Can you place more buys, or do you need to cut back? Project sales for the rest of the season using a seasonality curve and adjusting for lost sales. It’s important to understand what future promotions are in place as they may affect the peaks and lulls of the business. Those promotions should be built into the sales curve.
Question 5
How did you compare to the competition– How crowded was the field for products and how did you stack up? A competitive grid is helpful here, like what worked and didn’t, but listing each competitor and their pricing, etc. You can get a sample from our resources page here.
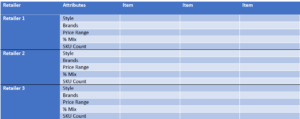
Compare product attributes across multiple retailers to see how your item stacked up.
We have great expertise, templates, and software to help answer these kinds of questions. Or check out our retail primer which covers all our best practices. For more information, please contact us today.

Comments are closed