
By Jim Lewis, CEO Enhanced Retail Solutions LLC
Overview
Estimating future sales is increasingly difficult with so many factors to be taken into consideration. The economy, inconsistencies in stock levels, changes in assortments and consumer shopping patterns to name just a few. Most inventory planners rely on historic sales to create their forecasts. However, that history may need to be adjusted to reflect a more realistic basis. While many forecasts are adjusted for seasonality, more robust adjustments can be made by integrating weather related demand. For product categories that are affected by weather- including temperature or precipitation- fine tuning a forecast based on this feature engineered demand signal significantly improves the predictability of future sales. ERS and Planalytics have partnered together to help companies improve their forecasting accuracy. This example breaks down the step-by-step process we utilize for our comprehensive approach to forecasting.
Step 1: Data Requirements and Technology Platform
POS data by location (store) is essential in building the most accurate forecast. You need a consistent flow of data over a sufficient period to provide a reasonable basis. While most of us live in Excel, it is not the most efficient means to manage large amounts of data integration and run all the calculations. For manufacturers and retailers that must forecast thousands, hundreds of thousands, or millions of SKU’s, a more sophisticated and automated approach is required. A system like ERS’s intelligentretail.net application will automate and manage the data, parameters (lead time, sales curves, etc.), logic and business rules. The system uses a SQL based relational database and is connected to a powerful visualization tool- Microsoft’s PowerBI.
Step 2: Collecting the Data
Ensuring a consistent flow of sales and inventory data is essential to accurate reporting and forecasting. Unit sales and on hand inventory are the minimum data points required to do the analysis. There are multiple ways to collect sales and inventory data including the EDI 852 and getting data directly from retailer’s portals. We prefer EDI because it can be automated end to end and once translated can be stored in a relational database.
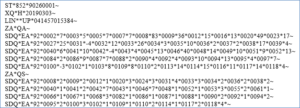
Example of EDI 852 raw data that can be translated and fed into a database. It can contain unit and dollar sales as well as on hand inventory by SKU by store.
Our partner, Planalytics provides weather-driven demand analytics by product category by date by location. This enables us to quantitatively understand how the weather is expected to impact sales from store to store. These analytics can be integrated into ERS at scale to drive a variety of business benefits, including improvements to demand forecast accuracy.
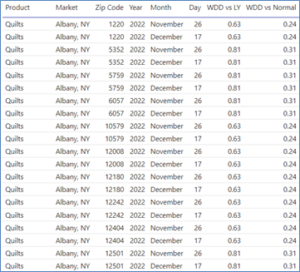
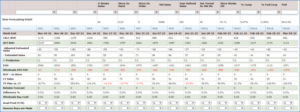
Example of Planalytics weather-driven demand data.
Step 3: Understanding the Basic Logic
Forecasting can be as simple or sophisticated as you want it to be. The most used logic utilizes a sales curve (or seasonal profile) to determine potential. It’s basic algebra- if you can determine how much business was done on one part of the curve, then you can mathematically figure out what any other point will be. The key is to use an accurate sales curve that depicts customer traffic patterns.
Example:
Last 13 weeks sales units: 1,000
Sum of the season (curve) for the last 13 weeks: 7.5%.
Annual potential: 1,000/.075 = 13,333 units.
Let’s say you want to estimate sales for the next week. And let’s say next week is worth 1.1%. Just multiply the annual potential times the curve percent:
13,333 X .011 = 147 units
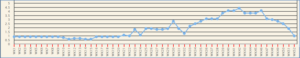
Graph of sales curve data showing the percent of business by week. Note peaks and lulls.
They key is to ensure your sales curve is realistic. It can be based on customer transactions (foot traffic) or sales history. A curve can be based on various levels- categories, subcategories, even down to color or sizes. If based on historic trends, the sales curve should be adjusted for calendar shifts (Ex. Christmas or Easter changes from year to year), promotional activity, etc. For our purposes, we use category curves.
Step 4: Adjusting for Lost Sales
The logic works well if the history (last 13 weeks sales) represents a valid benchmark. But what if a high percentage of stores were sold out during that period? Or some other situation occurred that drew sales away from your item? In that case we want to adjust the basis for lost sales. A lost sale occurs when a store runs out of merchandise (On Hand = 0) and there is still time left in the season to sell. In the case of stock outs, we need to determine the rate of sale when a store was in stock, then calculate what was lost when they were out of stock. Doing this calculation at store level builds a bottoms-up basis which is more accurate.
Example:
Store 1234 sold on average 6 units per week when in stock. It was out of stock for 3 weeks. Lost sales = 6 X 3 = 18 units.
This may not seem like a lot, but when added up for all stores and all SKU’s, it can be significant. It documents how optimal allocation was. Once our basis has been adjusted, we can run the logic in Step 3 to come up with our forecast.
The rolling forecast from ERS’ intelligentretail.net platform. Based on POS data, sales curves, and various parameters it calculates estimated sales and inventory needs by week and month.
Step 5: Fine Tuning with Weather-Driven Demand Analytics
Shopping patterns are affected by weather. It can influence overall store traffic and demand for specific products. If we know how the weather impacts a specific store, we can make further adjustments to our forecast. Our partners at Planalytics provide the expected change in demand due to the weather, for each product, location, and time period.
Example:
Store 1234 has a forecast of 300 units for next week. The Planalytics data for this location, for this product category shows an expected increase of +12% due to the weather. We can now take our 300 units X 1.12 to get an adjusted forecast of 336 units.
Step 6: Putting the Information Together
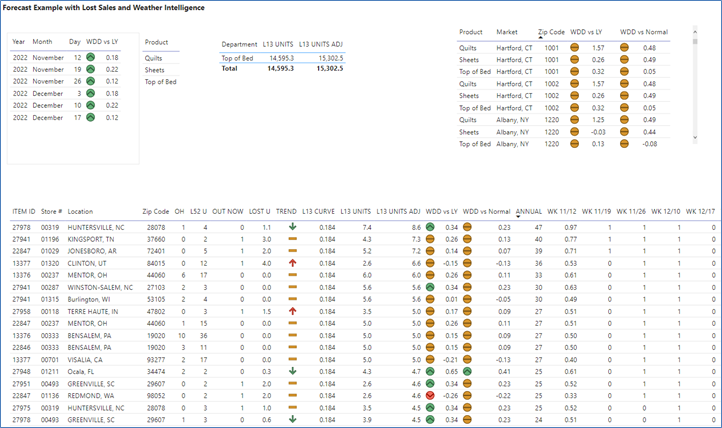
By integrating all the data on the ERS platform, including the Planalytics weather-driven demand data, all the logic and steps happen automatically. We can now review our data in the visualization tool.

Integrating forecast data and weather driven demand in Microsoft Power BI.
Conclusion
Improving forecast accuracy can have a significant impact on both sales and profit. And because your inventory utilization is better, the cost of capital goes down. If you are currently forecasting in a spreadsheet, you could save a significant amount of time by automating. One of the benefits of the BI tools is seeing exceptions- items with low or high inventory, changes in trends or buys that are needed right away, and accounting for demand fluctuations due to the weather. It serves as an alert system which helps you quickly react to opportunities and address risks. Furthermore, this process can be customized to meet the individual needs of your business.
For more information, contact Enhanced Retail Solutions at 646.553.6800 or visit www.enhancedretailsolutions.com.
Comments are closed