

By Jim Lewis, CEO Enhanced Retail Solutions LLC
People love dashboards. But unless it is actionable or telling them something they don’t know, they get boring quick. A good dashboard should provide insights that would otherwise go unnoticed. An even better dashboard is one that provides something that is specifically actionable.
Specifically actionable means it must lead the user to an opportunity or liability that can be acted on. In our world that means pointing out items and stores that are sold out, items with too much inventory, a shift in size or color, etc. It’s more than just filtering. It must be smart. For example, it doesn’t need to show you items that are selling out quickly if they are marked down.
Digestion
The information presented in a dashboard should reflect the reader’s role. For example, sales executives generally want to look at things at a high level with comparative information (TY v. LY, etc.). Planners require more detail- something that prioritizes problems or opportunities and gives them answers in 1 or 2 clicks. In general, a well-constructed dashboard should contain a balance of visualizations, easily digestible KPI’s and quick views of targeted information. It might include:
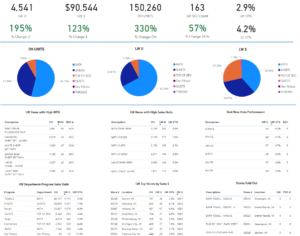
- The State of the business over different time periods. The core KPI’s and comparisons.
- Visualization of inventory and sales ratios. Should be drillable into departments, classes or whatever hierarchy is used.
- Interactive cards. This is the actionable area. Rank the opportunities and liabilities and have a link to a template or data feed with calculations on it for easy implementation. For example, for sold out items, click on the item and get an allocation, pre-calculated by the system.
A good dashboard must be actionable.
We’ve Got the Power (BI)
There are several good visualization tools on the market to build dashboards. The key is having the expertise to know what to put in it, and how to connect and extract data at the various levels required. In many cases we custom design dashboards from scratch because it offers the ultimate degree of customization. For anything else we use Microsoft’s Power BI. It’s versatile and if you have a good knowledge of programming in Office (VBA) you’ll feel right at home.
Data
Regardless of the platform you choose, a dashboard is useless without data. We integrate POS sales and inventory, preferably at store level. For very large data sets, you can compact store level data into a summary view. You can also integrate other data sets such as a supplier’s wholesale inventory (from ERP) or tables containing promotions or seasonality.
For more information about how ERS can help you visualize your business, contact us.
Comments are closed