
By Jim Lewis, CEO Enhanced Retail Solutions LLC
Ladder plans are an essential tool for many inventory planners. They provide a week-to-week view of expected sales, inventory position and how things might play out with items. Some are very simple, with static estimates. Others are more intelligent with dynamic estimates that change weekly based on the current trend, upcoming promotions, seasonality, etc.
Ladders follow the concept of “plan and track”. Plan your sales, profit and inventory needs up front. Then tracks actuals against that plan. The original plan becomes a revised plan based on the trends.

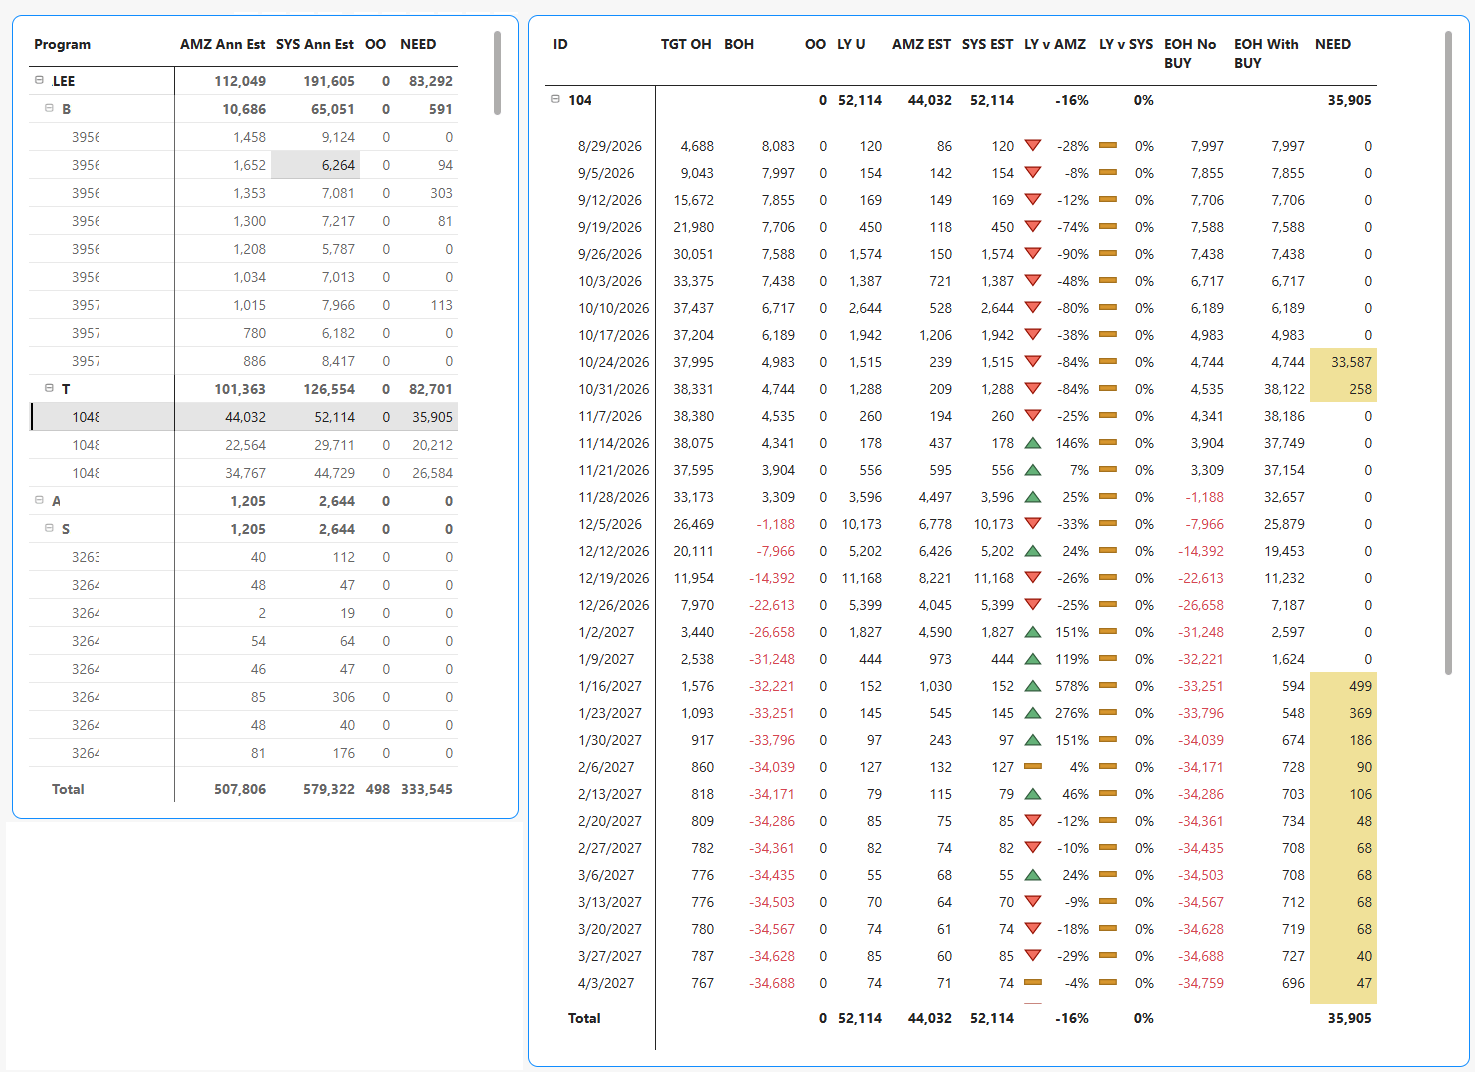
This example shows the week by week plan as well as year over year trends, projected inventory and calculated needs. Having 2 ending on hand columns is very helpful- so you can see what happens if you do place a buy and the consequences of what happens if you don’t place a buy.
Key Benefits
Most inventory planners use spreadsheets to manage their ladders, and nothing against that but it has limits. The benefit of a more sophisticated platform is that you are not limited to a select group of items or sku’s, no manual updating, formatting, sharing, etc. A living, breathing tool is the way to go.
Some of the key benefits of using ladder plans include:
- Understanding how the business is trending at both detail and high levels.
- Conducting “what-ifs” by adjusting sales estimates to see what will happen to inventory position in later weeks, for better or worse.
- Determining if there will be lost sales in future weeks based on lack of inventory.
- Based on promotional plans, determining whether profitability or meeting margin requirements will be possible. It can be used up front to help negotiate costs; if you know the promotions and expected sale prices, manipulating the cost will provide a sense of what profit margins could be with different costs and sale prices.
- Improve inventory flow and factory order placement.
- Project brand, category, class, etc. level financials for future periods.

Adding dollars to the plan turns the ladder into a financial planning tool.

Compare multiple estimate sources side by side. For example, if you are a wholesaler and you get forecasts from your retail partners, they can be integrated into the ladder. Then decide which one you want to use to project your inventory needs.
Using Data Integration and Automation to Scale
We’ve had a great tool for many years called Item Planner. It’s very effective but does require a fair amount of user interaction to maintain. But a funny thing happened on the way to Claude’s house. The majority of manual set up work and tinkering is now minimal. Users can spend less time manipulating and more time making decisions based on the output.
This improved scalability is possible because of our data and intelligence platform. We are now able to convert the intelligence and algorithms from our monthly demand planning tool into a weekly format. The result is a more precise and smarter ladder plan. It also ensures that every SKU has a ladder. But the user can view it at any level desired. This highlights any opportunities or liabilities that exist at lower levels that may not have been caught if a ladder was built at a higher level. Users can also customize the views and create any other calculations they need.

Click on an item and more information is provided. In this example we can track average selling price over time and how much business was done at the lowest, highest and middle price ranges.
Baking-In Intelligence
There are still parameters to manage, but they are shared with the forecast and automated set up. Some of the automation includes updating seasonality profiles and assigning the most appropriate forecast model to each sku each week. The system reviews the velocity, selling consistency, how sporadic selling is, volume and other factors- just like you do as a planner.
Probably the biggest advantage of moving away from spreadsheets is how much more interactive a dedicated tool is. Statistics that live in other data sets on the platform can be easily integrated. An example is if you are looking at a ladder plan and want to know what percentage of units are sold on sale, you can just drill through to a page that shows all the promotional and price data. This kind of “data at your fingertips” saves an enormous amount of time because you don’t have to open multiple reports.
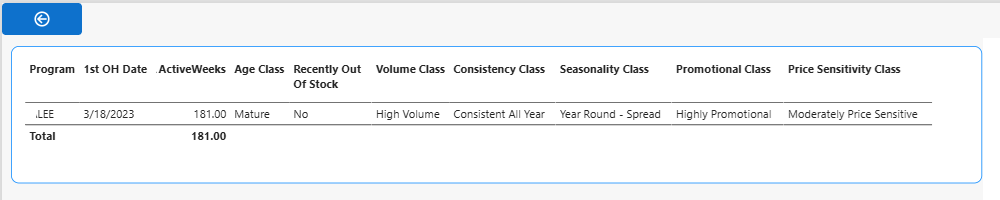
These statistics give us the life story of an item. When it started selling, it’s velocity, seasonality, promotional class and price sensistivity.
Regardless of how you do it, I highly recommend using ladder plans. Even if only for your key items. And they are not just for retail buyers; wholesalers can do the same and include both retail and wholesale inventories. If you are interested in templates for ladders, just let us know.
Comments are closed