
The 5 Requirements for Retail Reporting
By Jim Lewis, CEO Enhanced Retail Solutions LLC
Behind every great report is a great planner. Someone who knows what questions to ask and how to align data to answer them. At ERS we live and breathe reports and have seen thousands (seriously, we’ve been in business over 18 years). But what makes a report great? At the end of the day it comes down to how often it gets used and how much insight is gleaned from it. There are reports that can’t be lived without and others than go unread week after week. When onboarding new clients, we are generally asked to recommend a set of reports that will enable them to manage their business better. We incorporate our best practices and then take them to the next level. We strive not only to make great reports- but smart reports. Reports that do the thinking for you or point you in the right direction. These are my 5 must-haves for reporting.
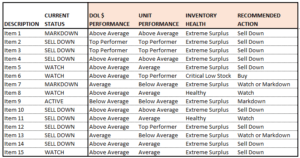
- Provides Actionable Insights. Most reports I have seen over the years are simply rows of data that require the reader to make heads or tails of it. Subtotals and highlights are great, but that doesn’t make the report smart. A smart report uses the same logic and benchmarks a planner uses when reviewing data. For example, this report recommends specific actions to take on each item- buy, markdown, watch, sell down or discontinue. The recommendation is based on 3 criteria- unit and dollar performance, and inventory health. There are 6 levels for each- from top performance to worst performance, or critically low inventory to extreme surplus. With 3 criteria and 6 ranges within each, there’s a possibility for over 200 combinations. Each combination yields a recommendation. For example, top performance for units, average performance for sales dollars and low inventory issues a recommendation of “Buy if Needed”. The report then puts each item in a separate tab based on the outcomes so you can quickly prioritize action. You can change the statistics, levels and recommendations to fit your business model.
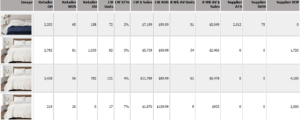
2. Has Visibility to the Total Pipeline. Planners on both the retail and supply side want to see each other’s inventory position at some point. Integrating them in one report is one of our top requests from clients. Seeing the total inventory on hand, available at warehouse and in production reduces surprises and saves the time and effort of having to look at additional reports or systems to get the information. And speaking of visibility- adding images to reports is extremely helpful- everyone in the organization knows which item you’re talking about.
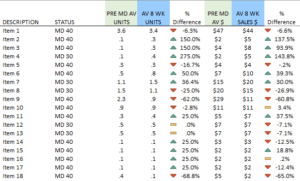
3. Contains Comparative Time Frames. You learn by comparing, so a smart report should provide either benchmarks or different time periods from which the reader can quickly determine trends. The most common are TY v LY, week over week and month over month. Average are also helpful- average of last 4 or 8 weeks, etc. whatever is relevant for your business. But there are other variations that can be helpful. For example, you may want to study performance before and after a markdown or promotion. This report shows the comparison in green and blue. Looking at the trend in this example helps determine whether deeper markdowns need to be taken.
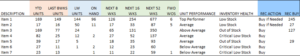
4. Shows the Past, Present and Future. Most people have the past and present aspects of a report down. But few incorporate the future. Forecasting is a discussion within itself, but even the simplest estimate of the next 8 weeks, or a few months can be helpful. A table of seasonal profiles (% of business by week) and quick algebra can provide some ballpark figures to know how much you could sell and if you have enough or too much inventory. In this example, these are all items with low inventory concerns. Instead of basing the WOS (weeks of supply) on the past, it’s based on the future. That is helpful if your category is affected by seasonality or heavy promotional activity.
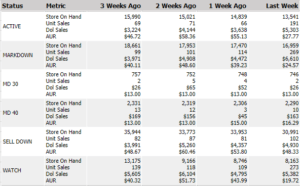
5. Helps Manage Item Status. For those retailers or manufacturers that have a significant amount of SKU’s to manage, status plays a vital role. It helps prioritize action that may need to be taken. I’ve seen companies with as many as 10 different statuses- which I think is too many. Stick to something like 5- Active, Watch, Markdown, Sell Down and Discontinued. Here’s a report that shows where the ownership is by status. Gives you a quick glimpse of how much inventory is tied up in actively selling items, or unprofitable marked down items.
I realize these pictures may be fuzzy, so if you would like examples, fell free to email me at [email protected].
Comments are closed