
By Jim Lewis, CEO Enhanced Retail Solutions LLC
We all know that turning inventory is the key to any successful retail business. Planning inventory involves many steps. Allocation by location can make or break sales. Studying geographic and demographic trends is a great way to improve inventory productivity. At ERS we’ve always been big proponents of studying sales and inventory at store level. It provides the greatest level of detail. Other benefits include studying price thresholds by region, whether certain styles, colors or sizes have broad appeal, determining marketing effectiveness and forecasting. Online businesses can take advantage of some of these benefits as well by using the zip code of shipping addresses rather than store addresses.
Step 1: Determine the Geographic Level
The first step is to break your data down into digestible pieces. You can get very granular and study at the city/state level or just state level. It really depends on what you are trying to accomplish. If you’re looking to get broad trends, the US Census breaks the country down into 9 regions: Pacific, Mountain, West North Central, East North Central, West South Central, East South Central, Middle Atlantic, South Atlantic and New England.
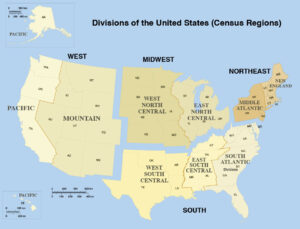
Map of US Census Regions from the US Census Bureau.
Step 2: Assign Data to Each Level
Using store addresses or ship to addresses assign each store or online customer to the region it falls into. This will serve as a lookup table for when you want to slice and dice your POS sales. Time also plays a key role. Do you want to look at a specific period together (ex. Sum of sales for the last 6 months) or look at it by time interval (week over week for the past 6 months). We like time intervals because we can track inventory to see if levels stay sufficient to satisfy demand.
Step 3: Decide on the Attributes
Ultimately the goal is to understand if a specific product attribute drives business in a certain way in a certain place. So, you need to think about what those attributes are. It varies by product type. For apparel things like silhouette, fabric, color, and size are the most common. For electronics it could be version or platform, etc. Geography also has attributes. Demographic information by zip code (age, sex, ethnicity, and income, etc.) from the US Census can also be integrated.
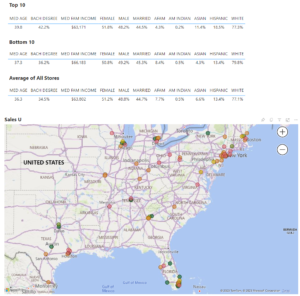
Integrating US Census data with POS data helps ensure the right products go to the right stores.
Step 4: Put the Data Together
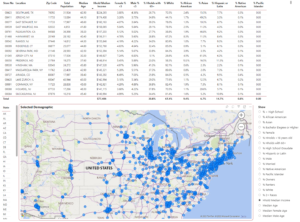
Depending on how much data you have will help determine which platform makes the most sense to use. Most companies will use Microsoft Excel because of its versatility. But it’s more manual and takes a deep skill set to take advantage of the more advanced features like pivot tables. A BI platform generally provides more versatility and greater visualizations. Microsoft’s Power BI also includes AI features that help find trends or relationships in the data that would most likely go unnoticed without them.
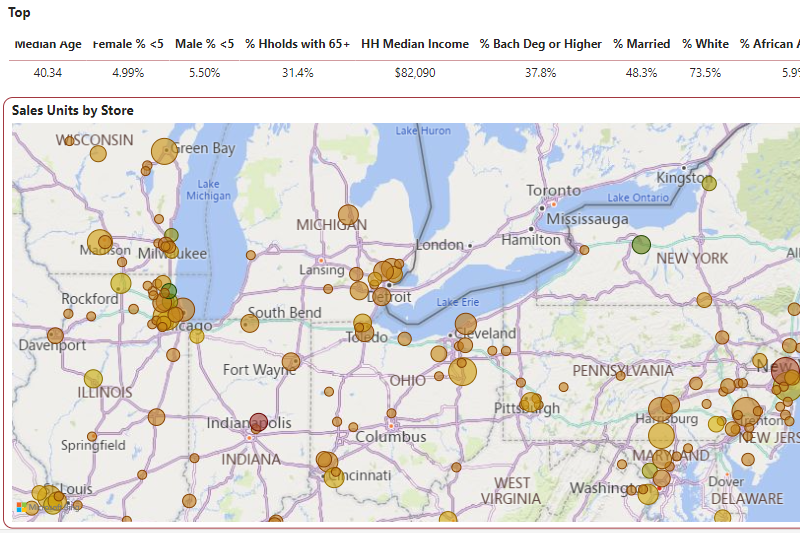
Understand the demographic makeup of the area surrounding your store
Step 5: Analyze
Once your data is set up, it’s time to learn! The best way to learn is by comparing and asking questions. Our first question is to see if top selling stores or regions have something in common? Are they all in high-income areas or do only certain colors or sizes sell there. And is the opposite true in poorly performing stores? Is a certain inventory level required to sell at a certain rate? Do higher priced items sell in one region vs. another. The questions depend on your business.
Summary
Conducting regional analysis not only helps improve allocation but can aid in assortment planning. By seeing how well a sku performs in a certain region can help you decide whether it truly earns a place in the assortment mix.
ERS offers several pre-set data sets to help you conduct this analysis. Contact us for more information.
Comments are closed